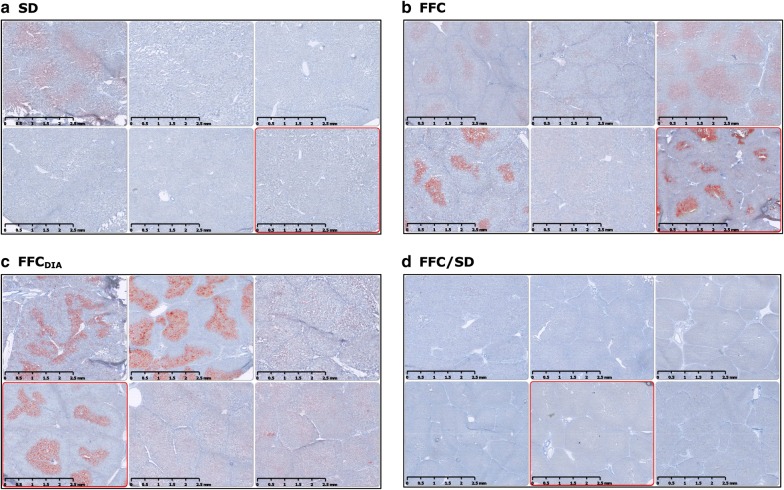
Fig. 7.
Heterogeneity of Oil red O staining of lipid within the diet groups. Six representative examples of lipid staining from six different animals within each group showing different patterns of lipid distribution. Scale bar 2.5 mm. a SD Lean control group. b FFC high fat/fructose/cholesterol diet group. c FFCDIA diabetic group. d FFC/SD diet-normalization group

