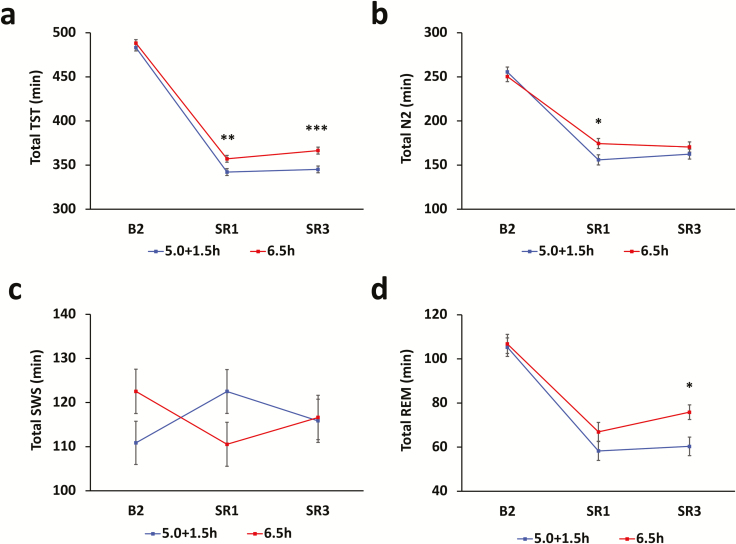
Figure 4.
Sleep parameters prior to the 4MT. Graphs represent combined sleep characteristics over each 24-hour period. (a) The 5.0 + 1.5h group obtained significantly less total sleep time than the 6.5h group during the sleep restriction period (SR1–SR3). (b) Underlying this difference was significantly less stage 2 sleep on SR1 and (d) less REM sleep on SR3. (c) Slow-wave sleep did not differ between groups at any point. Error bars represent SEM.

