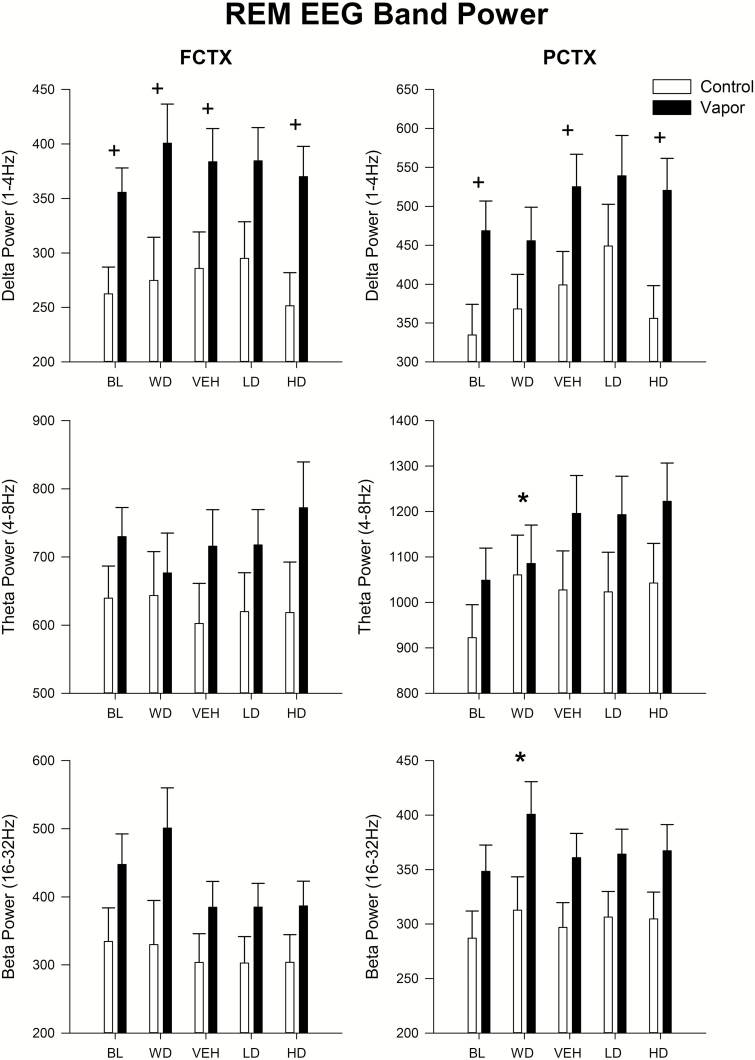
Figure 5.
Spectra power during REM episodes following alcohol vapor exposure and two doses of suvorexant. Means and standard errors shown for in the δ, θ, and β bands prior to vapor exposure, during withdrawal of vapor exposure and following vehicle and two doses of suvorexant (10, 30 mg/kg) in vapor-exposed animals and their controls. *Significant (p < 0.05) post hoc by condition compared with baseline or vehicle condition, + significant (p < 0.05) post hoc by group treatment. FCTX = frontal cortex; PCTX = parietal cortex; BL = baseline; WD = withdrawal; VEH = vehicle; LD = low-dose suvorexant 10 mg/kg; HD = high-dose suvorexant 30 mg/kg.

