
Fig. 8.
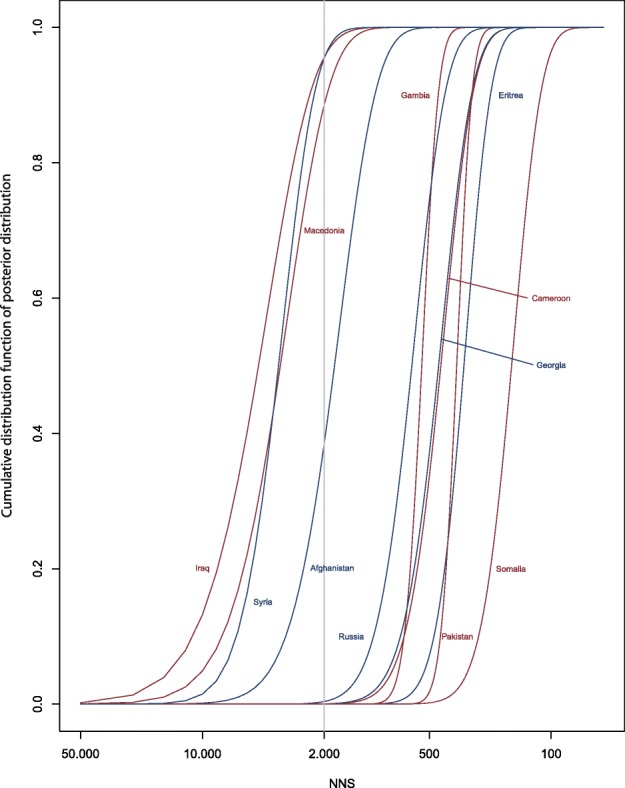
Plot of the probability that the posterior distribution of expected TB prevalence in asylum seekers from a given country of origin lies above a given NNS value
Official websites use .gov
A
.gov website belongs to an official
government organization in the United States.
Secure .gov websites use HTTPS
A lock (
) or https:// means you've safely
connected to the .gov website. Share sensitive
information only on official, secure websites.
Plot of the probability that the posterior distribution of expected TB prevalence in asylum seekers from a given country of origin lies above a given NNS value