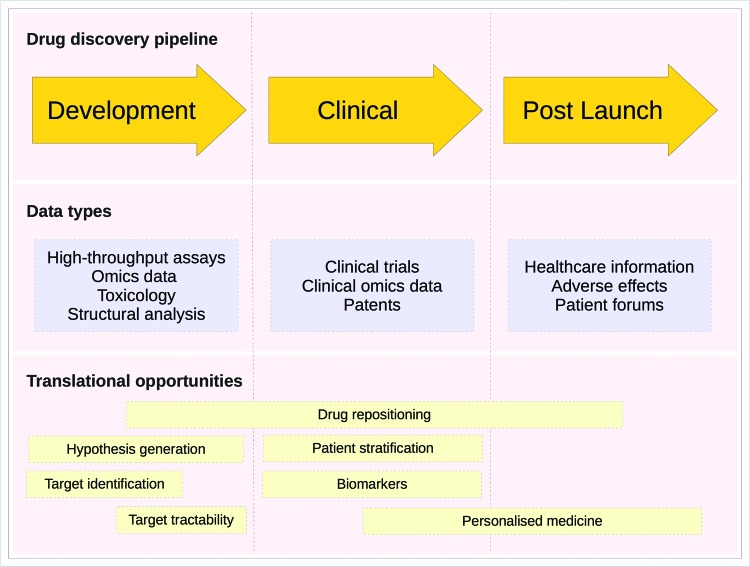
Figure 1. Translational bioinformatics opportunities in the drug discovery pipeline.
A schematic diagram of the drug discovery process. Each phase of the drug discovery pipeline (discovery, clinical and postlaunch) is shown as an orange arrow. Underneath the pipeline, shown as blue rectangles, are the types of ‘big data’ that can be generated in each step of the pipeline. Highlighted below the data types are the potential opportunities to improve the pipeline using bioinformatics techniques. For example, during the discovery phase, the focus is on identifying the druggability of potential target proteins. During the clinical trials, phase personalized medicine and patient selection can be used to better sample and categorize subjects while the use of biomarkers can improve efficacy measurements. Finally, at the post-launch phase of a drug’s life cycle drug safety monitoring and disease subtyping can be used to both improve the quality of life for patients as well as help to identify the opportunities for modified interventions that may be more effective for certain subtypes of a given disease. Adapted from [4], Copyright (2011), with permission from Elsevier.

