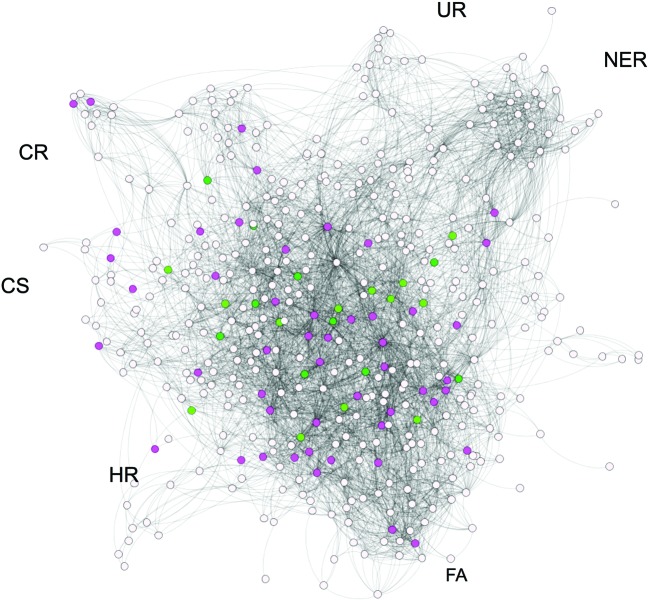
Figure 3. Druggable targets in the DNA damage response.
This illustrates the protein–protein interaction network of proteins (derived from the STRING database [114]) involved in the DNA damage response as described in [46]. Each protein is shown as a node/circle with the interaction described as a connecting line. The network is labelled by some of the DDR processes: HR; UR, ubiquitin response; FA, Fanconi anaemia; NER, nucleotide excision repair, CS, chromosome segregation; CR, chromatin remodelling. Nodes coloured dark green indicate a protein for which these is a licenced drug, light green nodes indicate that the protein is a target of a drug in clinical trials. Pink nodes indicate that a protein is predicted to be druggable as it has the features of a good drug target. Each of these proteins have been predicted to be druggable by the at least two of the druggability methods (ligand, structure and network) provided by the canSAR database [84]. Adapted from Supplementary Information (figure) S15 [46]. .

