
Figure 1.
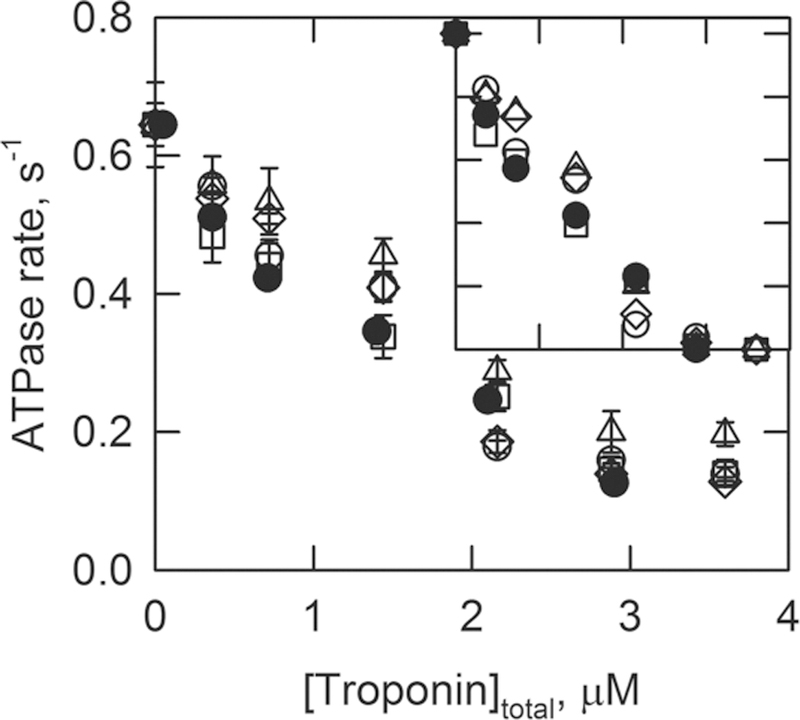
ATPase rates as a function of the ratio of concentrations of total troponin to actin. The troponin contained wild-type TnI and TnT. The TnC was the wild type (○), the A8V mutant (□), the D145E mutant (◇), or the C84Y mutant (△). The figure also shows data of skeletal troponin for comparison (●). The inset shows the ATPase rates normalized to the range of 0–1 for comparison among the troponin types. Measurements were taken at 25 °C and pH 7.0 in solutions containing 1 mM ATP, 3 mM MgCl2, 34 mM NaCl, 10 mM MOPS, 1 mM dithiothreitol, and 2 mM EGTA. The concentrations of S1, actin, and tropomyosin were 0.1, 10, and 2.2 μM, respectively. Data are plotted with the standard deviation.