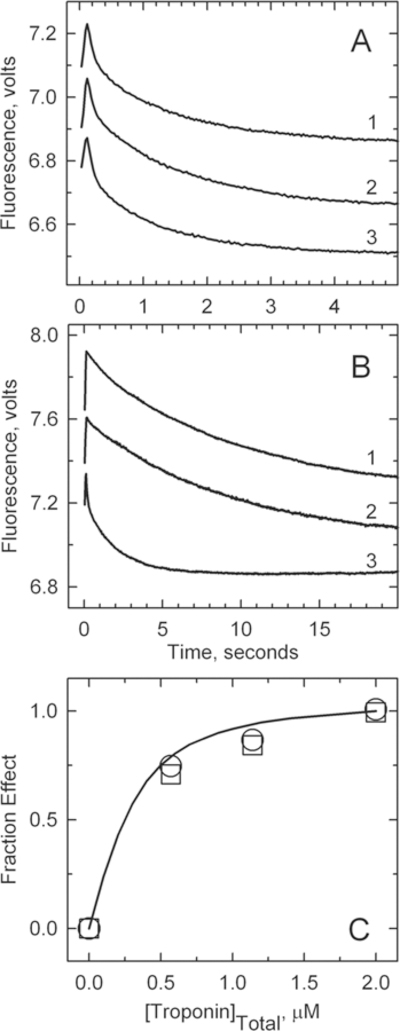
Figure 6.

Rate of binding of S1 to pyrene-labeled actin filaments containing tropomyosin and troponin in the absence of ATP. For this experiment, 4 μM pyrene–actin (40% labeled), 0.86 μM tropomyosin, and 2 μM troponin were rapidly mixed with 0.4 μM myosin S1 in a buffer containing 152 mM KCl, 2 mM EGTA, 20 mM MOPS buffer (pH 7), 4 mM MgCl2, and 1 mM dithiothreitol at 10 °C. (A) Low Ca2+ concentrations. Curve 1: wild type, kapp = 0.10 ± 0.01 s−1. Curve 2: A8V, k = 0.12 ± 0.02 s−1. Curve 3: A8V TnC and Δ14 TnT, kapp = 0.5 ± 0.02 s−1. Solid lines are monoexponential fits to each curve. (B) High Ca2+ concentrations. Curve 1: wild type, kapp = 0.77 ± 0.14 s−1. Curve 2: A8V, kapp = 0.70 ± 0.05 s−1. Curve 3: A8V TnC and Δ14 TnT, kapp = 0.91 ± 0.15 s−1. (C) Fraction of the maximal effect on the binding kinetics at low Ca2+ concentrations vs the free troponin concentration: wild type (○) and A8V (□). The highest point corresponds to the conditions used for the main figure. The fitted curve is for a dissociation constant of 0.12 μM.
