
Figure 6.
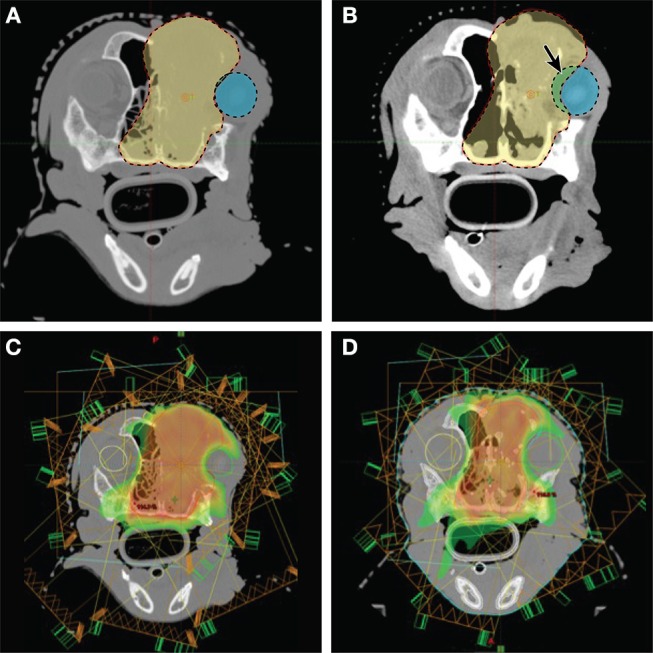
Imaging and radiation planning for adaptive radiotherapy. (A) (Upper left) Original radiation planning CT image with PTV (red line) contoured for a nasal carcinoma. (B) (Upper right) Mid-way through radiation treatment the tumor decreased in size. The shrinkage caused the right eye (blue shaded region) to fall within the original PTV (red shaded region). The purple shaded area shows the region of the eye now overlapping with the PTV, and is also noted with a solid arrow. (C) (Lower left) The original radiation planning heat map reveals regions of high dose (red/orange) and regions of moderate dose (yellow/green). The right eye (green circle) is originally planned to abut these dose regions. (D) (Lower right) A new “adaptive” radiation plan has been created to target the smaller, mid-treatment PTV. The right eye (green circle), is not only outside the PTV region, it is now farther away from the high dose (red/orange) and moderate dose (yellow/green) regions of the treatment field.