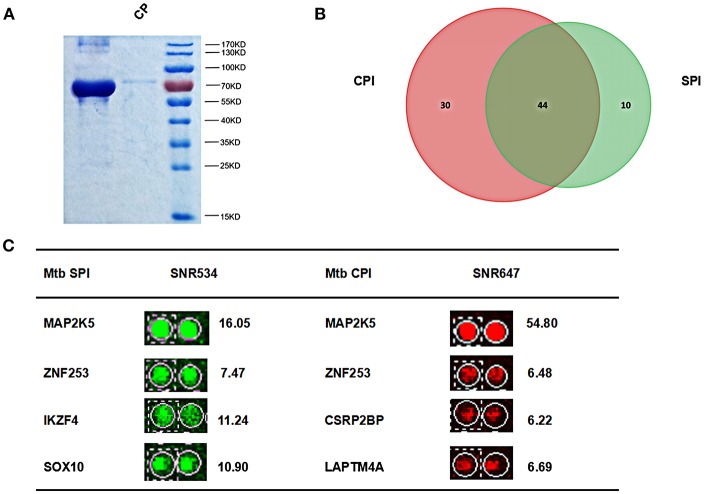
Figure 2.
Identification of Mtb SPI and CPI on a human proteome microarray. (A) Extraction and purification of Mtb SP and CP. The proteins were detected by SDS-PAGE followed by coomassie brilliant blue staining. (B) The Venn diagram of Mtb SPI (green) and CPI (red). (C) Representatives of the newly identified Mtb SPI and CPI. The cutoff for calling positive candidates was set as signal-to-noise (SNR) ratio > 2.0. Experiments were performed in two replicates.

