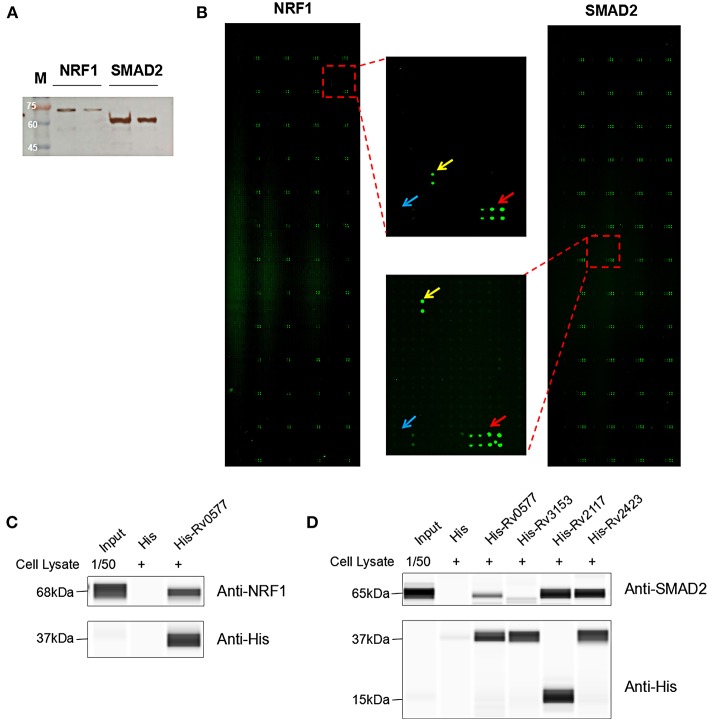
Figure 5.
The NRF1 and SMAD2 interactors identified on a Mtb proteome microarray and validation by His pull-down assay. (A) Silver staining to detect the purified NRF1-myc and SMAD2-myc. (B) NRF1 and SMAD2 binding study with Mtb proteome microarray. Each array contained Cy3 labeled BSA as a positive control (marked with red arrows) and BSA as a negative control (marked with blue arrows). Positive proteins were marked with yellow arrows. The cutoff for calling positive candidates was set as signal-to-noise (SNR) ratio ≥ 1.4 and Z-score ≥ 3.0. (C) His tagged -Rv0577 pull-down assay with endogenously expressed NRF1. (D) His tagged -Rv0577, -Rv3153, -Rv2117, and -Rv2423 with endogenously expressed SMAD2, respectively. Protein separation and detection were performed using an automated capillary electrophoresis system. The results are representative of two independent experiments.

