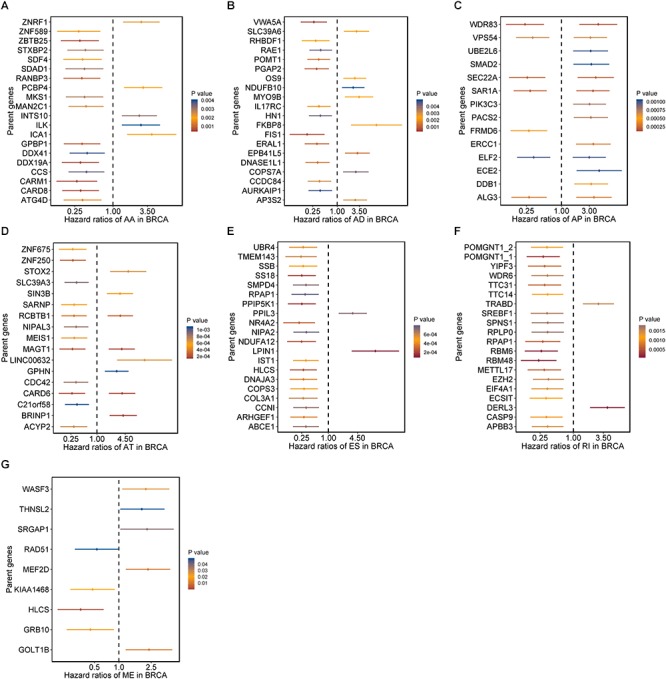
Figure 2.

Forrest plots of survival associated AS events in BRCA. (A–F) Hazard ratios and 95% confidence intervals of top 20 overall survival associated AA, AD, AP, AT, ES, and RI events, respectively. (G) Hazard ratios and 95% confidence intervals of significant OS associated ME events. P-values of univariate Cox analyses are indicated by color scale by the side.
