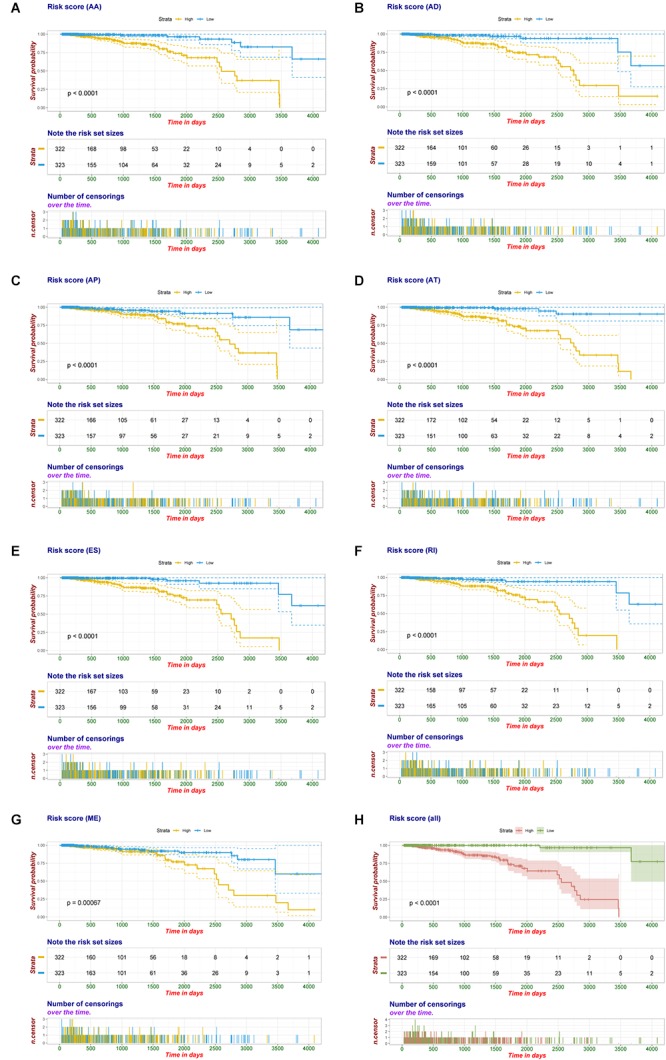
Figure 5.

Kaplan-Meier plot of prognostic signature built with AS events for BRCA patients. (A–G) Kaplan-Meier plot of prognostic signature built with AA, AD, AP, AT, ES, RI, and ME events, respectively. Yellow line indicates high-risk subgroup while blue line indicates low-risk subgroup. (H) Kaplan–Meier curves of final prognostic signature built upon all types of AS events for BRCA patients, in which red line represents high-risk subgroup and green line represents low-risk subgroup.
