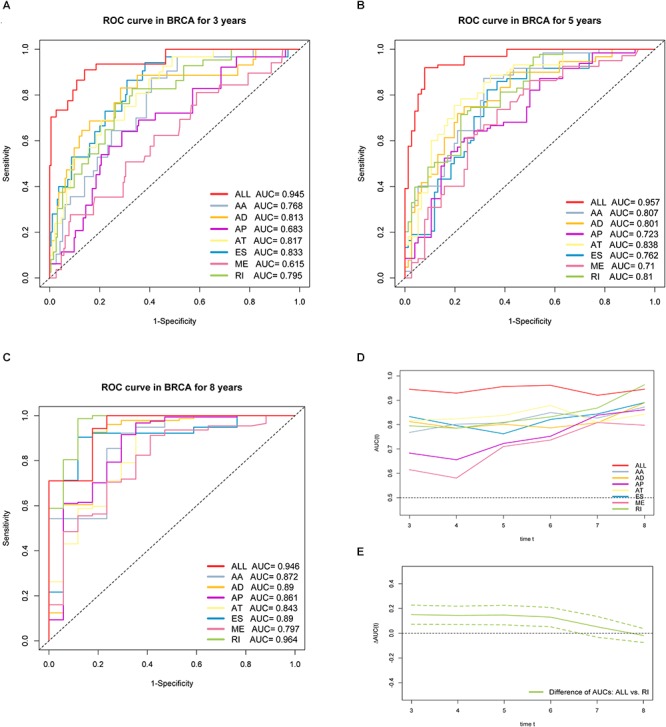
Figure 7.

ROC curves with calculated AUCs of prognostic signatures built by either one type or all seven AS types in BRCA cohort for risk prediction in 3 years. (A) 5 years (B) and 8 years (C), respectively. (D) The curves of time-dependent AUCs versus time (3–8 years) of either each or final signature: AUC(t) versus t. (E) The curve of the difference of time-dependent AUCs between final and RI signature over time (3–8 years):  AUC(t) versus t. The color dashed bands indicated the pointwise 95% confidence intervals of estimated AUCs difference. The dashed line evaluates whether the difference of two estimated AUCs at each timepoint is statistical significance.
