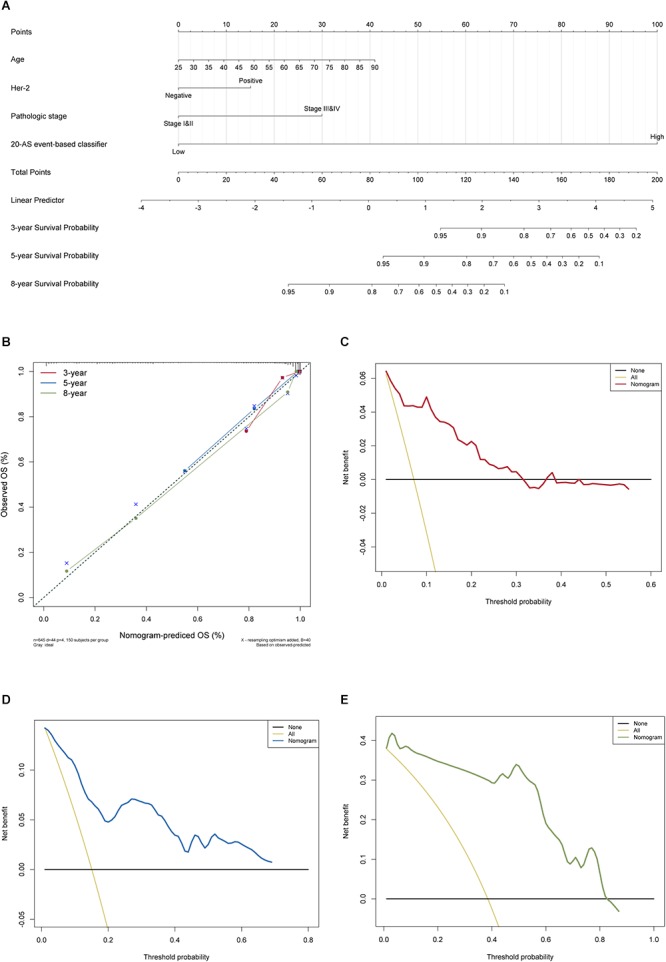
Figure 8.

The AS-clinicopathologic nomogram for prediction on survival probability in patients with BRCA. (A) Development of AS-clinicopathologic nomogram for predicting 3-, 5-, and 8-years OS for BRCA patients, with the final AS signature, age, pathological stage and Her-2 status incorporated. (B) Calibration plot of the AS-clinicopathologic nomogram in terms of agreement between nomogram-predicted and observed 3-, 5-, and 8-years outcomes in BRCA cohort. The actual performances of our model are shown by red, blue and green lines. And the dashed line of 45° represents the ideal performance. (C–E) Decision curve analyses of the AS-clinicopathologic nomogram for 3-, 5-, and 8-years risk in BRCA cohort. The yellow line represents the net benefit of treat-all scheme varying with threshold probability, while the black line represents the net benefit of treat-no scheme. The net benefits by using our nomogram for predicting 3-, 5-, and 8-years OS are displayed with red, blue, and green lines, respectively.
