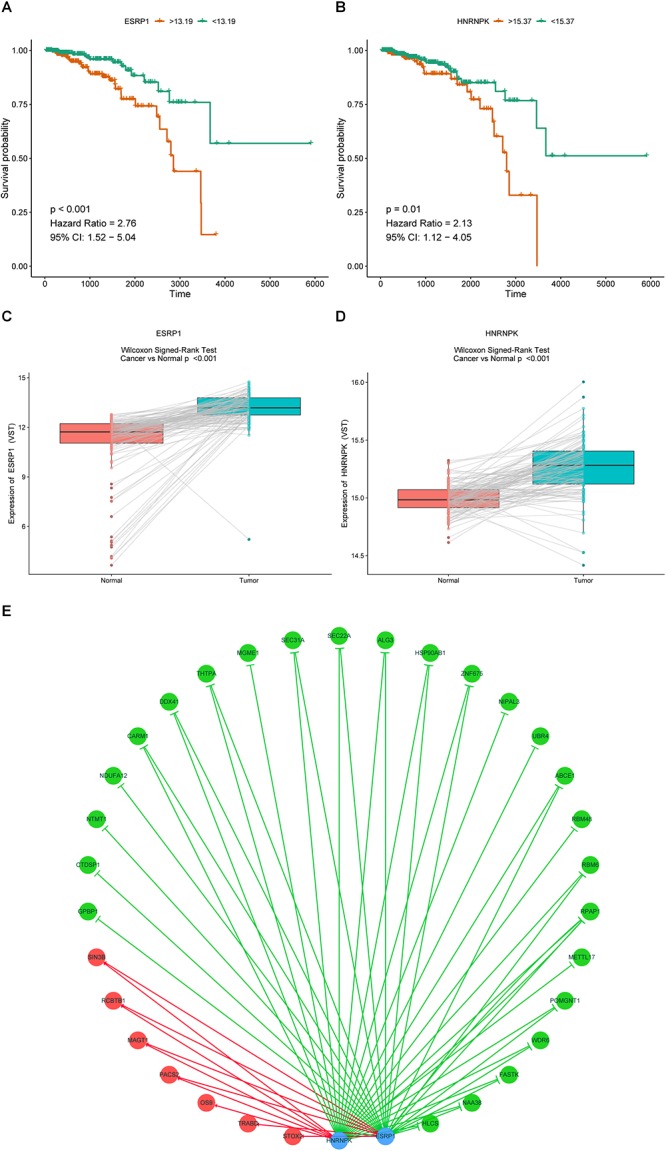
Figure 9.

Prognostic SFs and the splicing correlation network in BRCA. (A,B) Survival curves of prognostic SFs. (C,D) The difference of expression values of prognostic SFs between primary BRCA and paired adjacent normal tissues. (E) Construction of SF-AS regulatory network. Expression values of survival-associated SFs (blue dots) were positively (red line) or negatively (green line) correlated with PSI values of AS events included in all types of AS signatures. The protective AS events are indicated by green dots while risky AS events are indicated by red dots.
