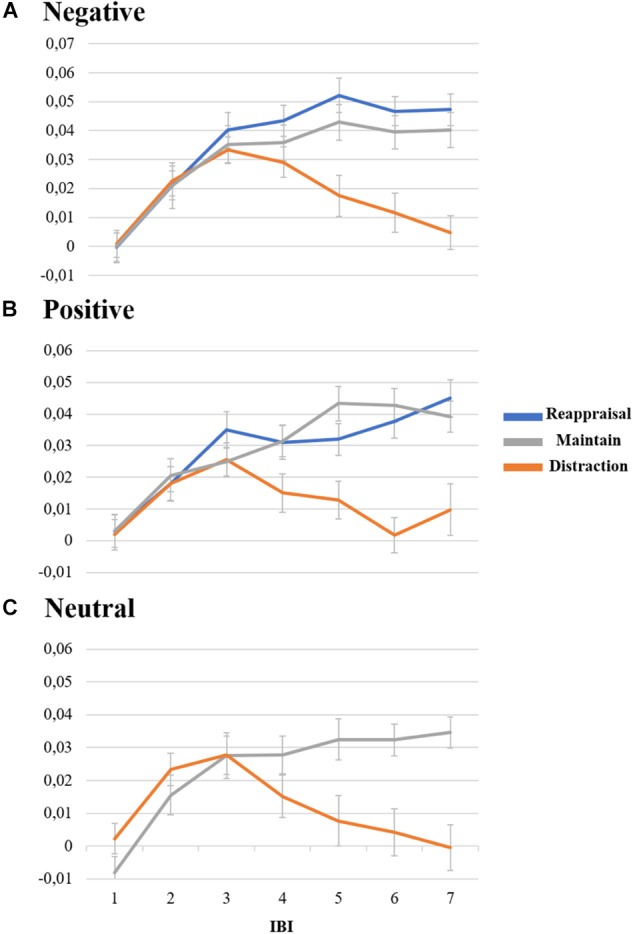
Figure 4.

Representation of IBI variation during the task of emotion regulation. Lines are divided by strategy, where values represent IBI delta value, and spreads represent standard error. (A) Value of IBI for negative pictures. (B) Value of IBI for positive pictures. (C) Value of IBI for neutral pictures.
