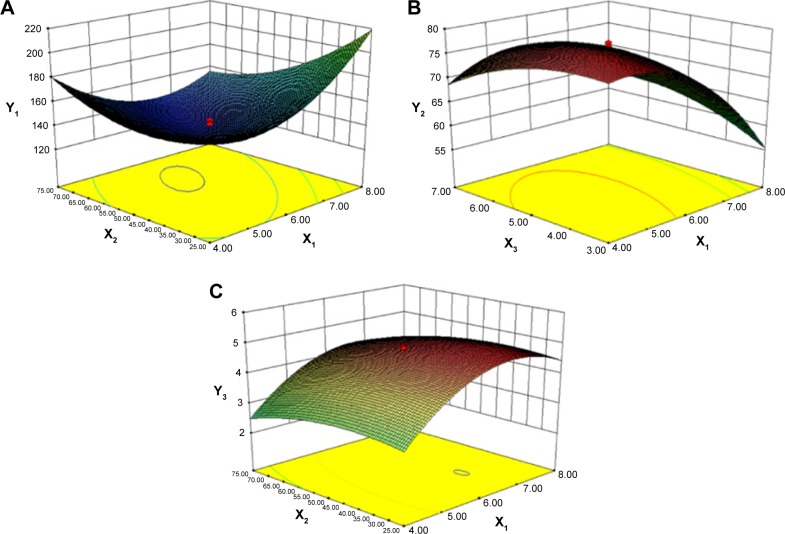
Figure 2.
Response surface models showing the influence of the factors on the responses.
Notes: Three dimensional response surface plots showing the effects of (X1) total lipids concentration (%), (X2) ratio of liquid lipid to total lipid (%), and (X3) surfactant concentration (%) on the responses of Y1 (A), Y2 (B), and Y3 (C). Y1 is the response of the mean particle size, Y2 of entrapment efficiency, and Y3 of drug loading.

