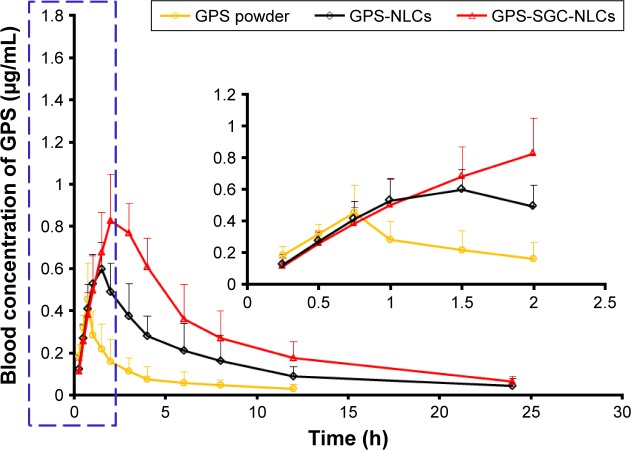
Figure 8.
In vivo plasma concentration–time profiles. Levels of GPS following oral administration of GPS powder suspension, GPS-NLCs, and GPS-SGC-NLCs (n=6). Note: The data for the drug-time curve within first two hours shown in the blue dashed line box is presented in the inset.
Abbreviations: GPS, gypenosides; GPS NLCs, gypenosides loaded nanostructured lipid carriers; GPS SGC NLCs, gypenosides loaded nanostructured lipid carriers containing a bile salt.

