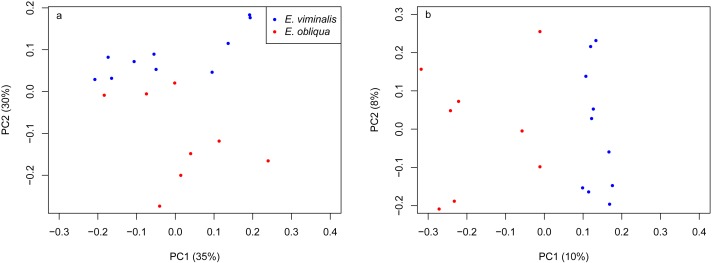
Figure 3. PCoA of β diversity based on UniFrac matrices from the Cape Otway 2015 koala collection.
Scatterplots from (A) weighted and (B) unweighted UniFrac matrices for koalas with diets comprising E. viminalis and E. obliqua from the 2015 collection year. The influence of diet was significant in 2015 (A) weighted UniFrac, pseudo F1 = 8.89, PERMANOVA P = 0.0001; (B) unweighted UniFrac, pseudo F1 = 2.76, PERMANOVA P = 0.0001.

