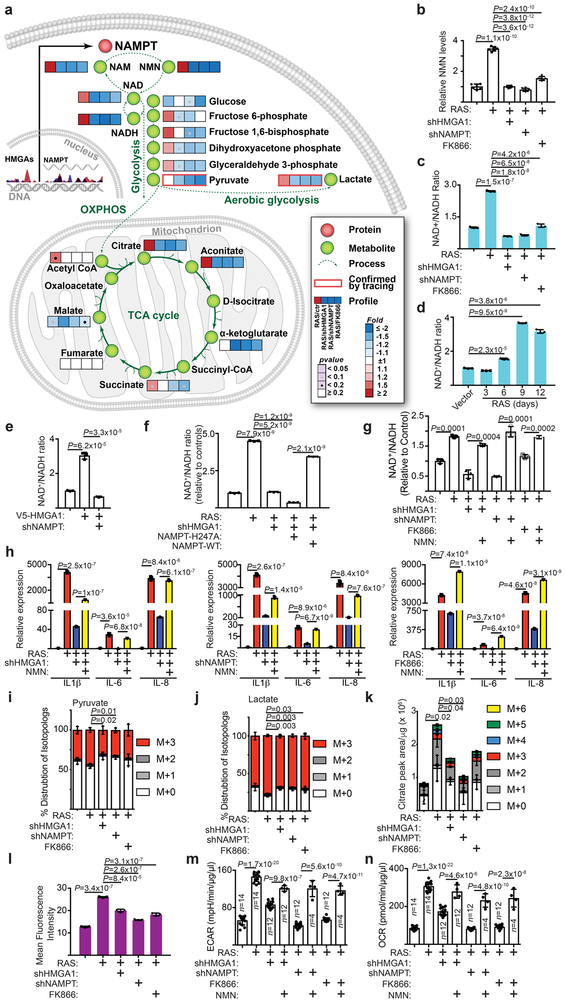
Figure 3. NAD+ metabolism drives proinflammatory SASP.
a-c, In established senescent cells, HMGA1 or NAMPT were knocked down using the indicated short hairpin RNAs. The NAMPT activity was also inhibited by FK866. Steady-state metabolite levels were measured by LC-MS/MS. Heat map indicates fold change in comparison to the control condition (a) (n=6 independent experiments). NMN (b) (n=6 independent experiments) and NAD+/NADH ratio (c) were determined in the indicated cells. d, Cells were induced to senesce by oncogenic RAS and analyzed for the NAD+/NADH ratio at the indicated time points. e, Cells with or without ectopic V5-tagged HMGA1 expression with or without NAMPT knockdown were examined for the NAD+/NADH ratio. f, The NAD+/NADH ratio was determined in established senescent cells with or without HMGA1 knockdown with or without ectopic expression of a FLAG-tagged wild type or catalytically-inactive NAMPT. g,h, In established senescence, HMGA1 or NAMPT were knocked down using the indicated shRNAs. The NAMPT activity was also inhibited by FK866. Under these conditions, cells were treated with NMN and the NAD+/NADH ratio (g) and expression of the indicated SASP genes (h) were determined by qRT-PCR. i-k, Cells from the conditions as in (a) were incubated for 6 hours in the presence of 13C6-glucose and intracellular metabolites were extracted for analysis by LC-MS to evaluate glycolytic flux in the form of pyruvate (i) and lactate (j) and mitochondrial respiration rates as indicated by citrate production (k). Data were normalized based on protein concentration. l, Cells from conditions as in (a) were incubated with a fluorescent glucose analog (2-NBDG) and analyzed by flow cytometry for glucose uptake. m,n, Cells from the conditions in (g) were analyzed using Seahorse Bioanalyzer XFe96 for extracellular acidification (ECAR) (m) and oxygen consumption (OCR) (n). Data were normalized based on protein concentration. n = 3 independent experiments unless otherwise stated. All graphs represent mean ± s.d. P values were calculated using a two-tailed t-test. Statistical source data are provided in Supplementary Table 1.

