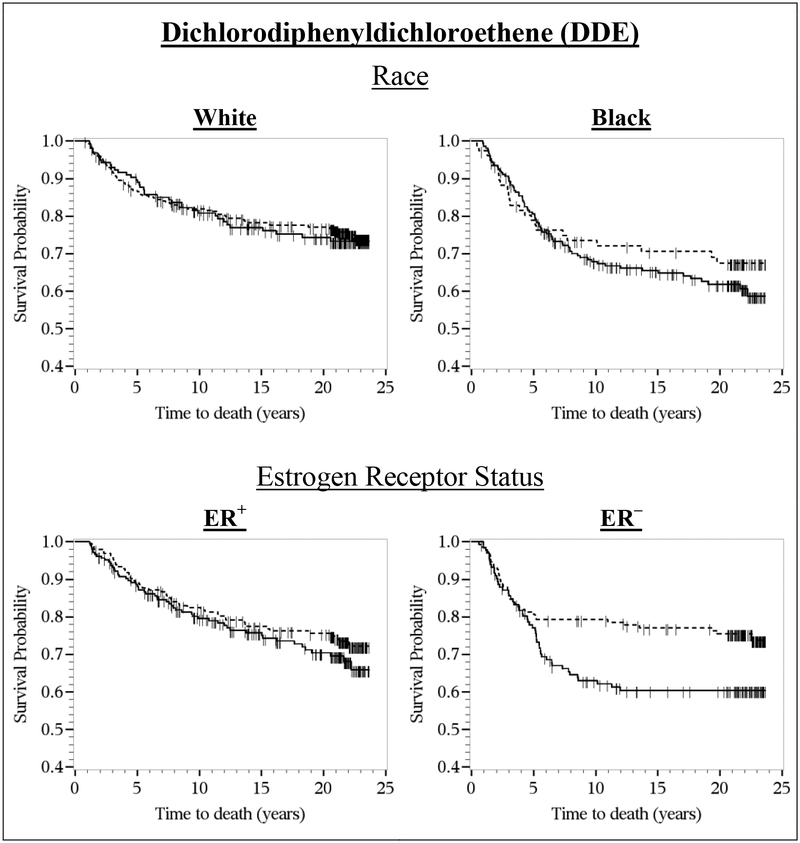
Figure 2.
Kaplan-Meier survival curves for DDE (dashed line, ≤0.58 μg/g lipid; solid line, >0.58 μg/g lipid) and breast cancer-specific survival, overall and by race and estrogen receptor (ER) status. CBCS women were diagnosed with invasive breast cancer from 1993–1996 (Phase I) and followed-up for vital status through December 31, 2016. The x-axis shows times to death in years; the y-axis shows proportion of participants alive.

