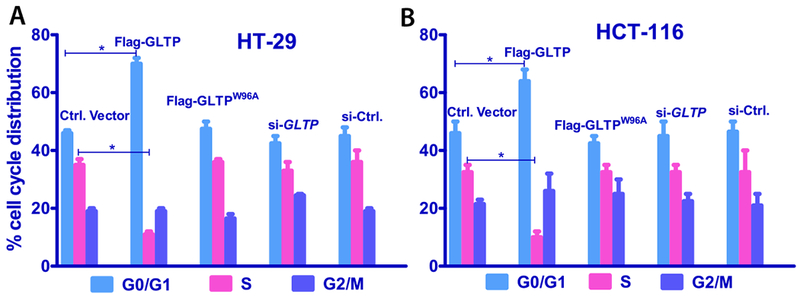
Fig. 2. Inhibition of cell cycle progression in human colon carcinoma cells by GLTP overexpression.

(A) HT-29 and (B) HCT-116 cells were analyzed for percent cell cycle distribution following 48 h post transfection with FLAG-tagged empty vector (Ctrl Vector), GLTP overexpressing vector (FLAG-GLTP), GLTP mutant (W96A, with an ablated glycolipid binding site) overexpressing Vector (FLAG-W96AGLTP), reduced GLTP expressing vector (siGLTP) and non-targeting siRNA control vector (siCtrl). Overexpression of GLTP (FLAG-GLTP) slowed cell growth in HT-29 and HCT-116 cells by increasing G0/G1 populations at the expense of S phase populations. Experiments were done in triplicate and values were means ± sem. *P<0.05, **P<0.01, **P<0.001 Student t-test. (see Suppl. Fig. S3 for 24 h data).
