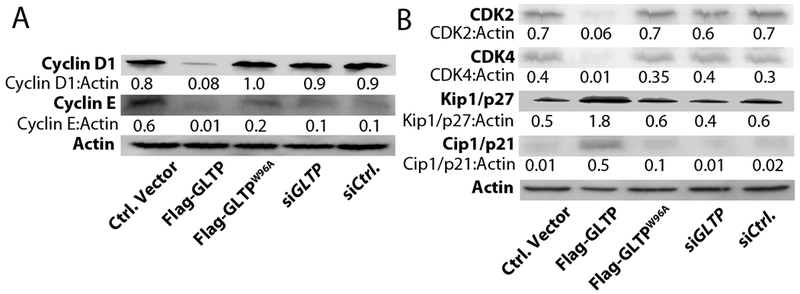
Fig. 3. Upregulation of Kip1/p27 and Cip1/p21 levels and modulation of CDKs by GLTP overexpression.

Western blot images of HT-29 cells at 48 h post transfection with indicated vectors. (A) Decreased levels of Cyclin D1 and Cyclin E induced by wtGLTP overexpression are shown. By contrast, alterations are minimal with mutant GLTP (W96A) overexpression and nonexistent with GLTP depletion (siGLTP) compared to vector-control cells. (B) Increased levels of Kip1/p27 and Cip1/p21 and decreased levels of cyclin-dependent kinases (CDK), CDK2 and CDK4 induced by wtGLTP overexpression. Quantitative insights are provided by ratiometric comparisons of band intensities to Actin (loading ctrl.)
