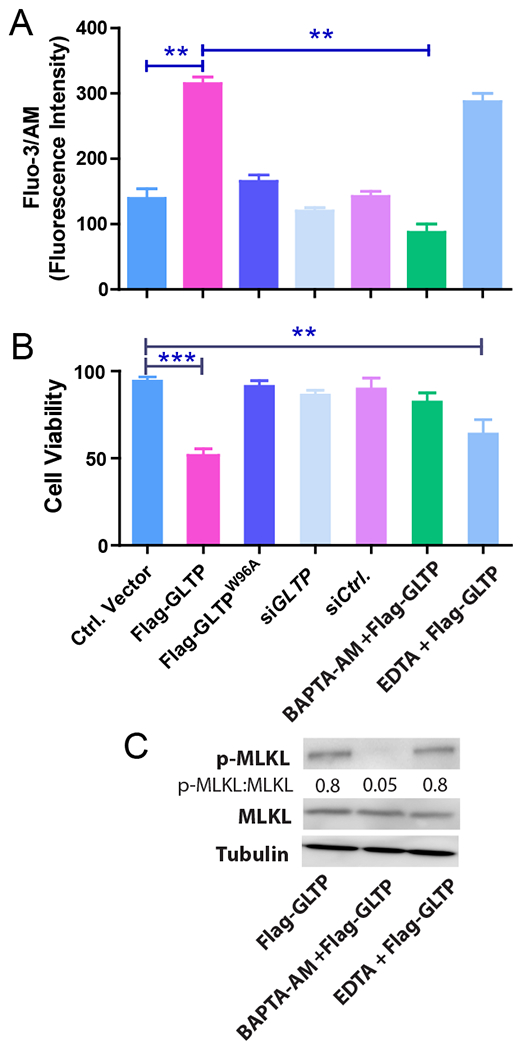
Fig. 5. GLTP overexpression releases Ca2+ from internal stores to drive necroptosis.

(A) Intracellular Ca2+ levels were measured using cell permeable Fluo-3/AM fluorescent probe in conjunction with flow cytometry of HT-29 cells. Following GLTP overexpression, intracellular Ca2+ accumulation was observed which was significantly reduced by pretreatment with BAPTA-AM (1μM), an intracellular Ca2+ chelator but not with EDTA (25 μM). siGLTP treatment or overexpression of GLTPW96A mutant (Flag-GLTPW96A) did not change Ca2+ levels compared with mock transfected empty vector ctrl or non-targeting siRNA ctrl. (B) Chelation of intracellular Ca2+ by BAPTA-AM, but not extracellular Ca2+ by EDTA, significantly abrogated HT-29 cell viability loss induced by GLTP overexpression as determined using trypan blue analyses. Experiments were done in triplicates and values reported are means ± sem. *P<0.05, **P<0.01, **P<0.001 using Student t-test. (C) WB analysis of p-MLKL and MLKL levels in HT-29 cells transfected with GLTP overexpressing vectors either alone or pretreated with BAPTA-AM or EDTA. Quantification is provided by ratiometric comparisons of band intensities. Tubulin = loading ctrl. (see Supplemental Fig. S5 for HCT-116 cell data)
