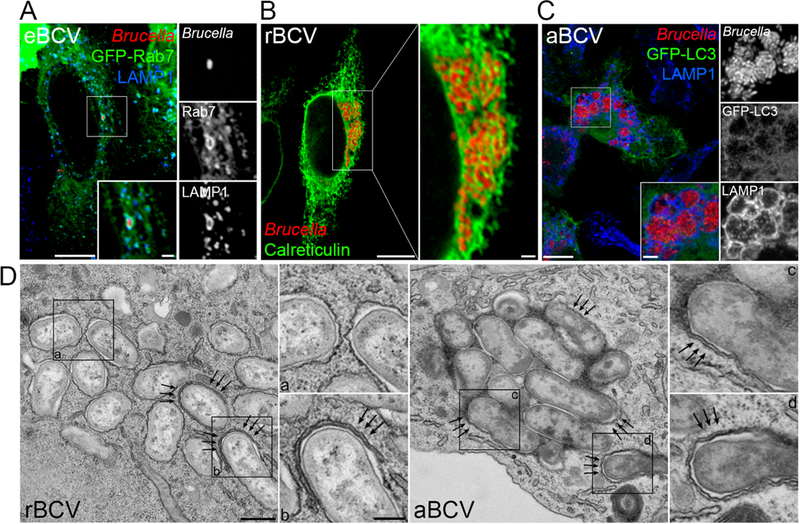
Figure 2. Structure and membrane composition of BCVs during the Brucella intracellular cycle.

(A) Confocal fluorescence micrograph of a HeLa cells expressing GFP-Rab7 and infected with DsRedm-expressing B. abortus strain 2308 for 6 h. The inset shows an eBCV typified by the accumulation of the late endosomal/lysosomal markers Rab7 and LAMP1. Scale bars, 10 and 2 µm. (B) Confocal fluorescence micrograph of a HeLa cells infected with DsRedm-expressing B. abortus strain 2308 for 24 h and stained for the endoplasmic reticulum (ER) marker Calreticulin. The inset shows a cluster of Calreticulin-positive rBCVs containing replicating bacteria and associated with the ER network. Scale bars, 10 and 1 µm. (C) Confocal fluorescence micrograph of a primary murine bone marrow-derived macrophage (BMM) expressing the autophagy marker GFP-LC3 and infected with DsRedm-expressing B. abortus strain 2308 for 72 h. The inset shows a group of aBCVs typified by the accumulation of the late endosomal/lysosomal LAMP1, but not LC3. Scale bars, 10 and 2 µm. (D) Transmission electron micrographs of BMMs infected with B. abortus strain 2308 for 72 h and showing the ultrastructures of rBCVs (left-hand image, single membrane-bound vacuoles, inset a), of forming aBCVs (inset b and arrows) and of completed double membrane-bound aBCVs (right-hand image, insets c and d and arrows). Scale bars, 500 and 200 nm. Images reprinted from Cell Host&Microbe (Starr 2012) with permission of the publisher.
