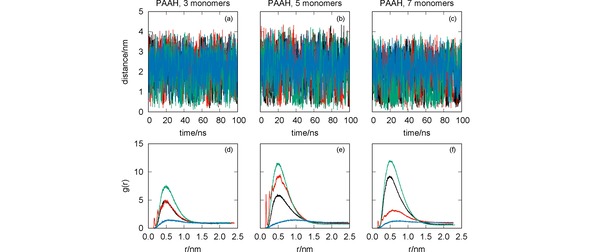
Figure 3.

MD simulation of the systems CYM+PAAH (black lines), GLF+PAAH (red lines), IMI+PAAH (green lines) and MAN+PAAH (blue lines): oligomer‐pesticide distance vs. simulation time [panels (a)–(c)]; radial distribution functions [panels (d)–(f)]. The effect of the oligomer length has been assessed with simulations for PAAH with three [panels (a) and (d)], five [panels (b) and (e)] and seven [panels (c) and (f)] monomers.
