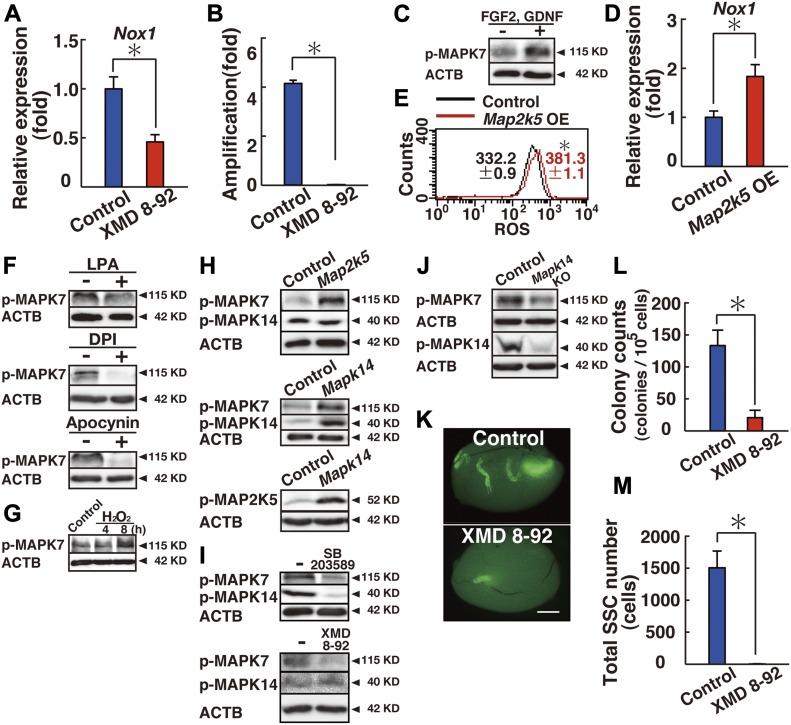
Figure 3. Regulation of Nox1 expression by MAPK7 in GS cells.
(A) Real-time PCR analysis of Nox1 expression 1 d after supplementation of XMD 8-92 (n = 6 cultures). *P < 0.05 (t test). (B) Defective proliferation of GS cells exposed to XMD 8-92 (n = 9 cultures). GS cells were cultured with XMD 8-92 for 5 d. *P < 0.05 (t test). (C) Western blot analysis of MAPK7 in GS cells treated with self-renewal factors. GS cells were cultured without cytokines for 3 d and restimulated with GDNF and FGF2 for 3 h. (D) Real-time PCR analysis of Nox1 expression 1 d after transfection of constitutively active Map2k5 (n = 6 cultures; moi = 4). *P < 0.05 (t test). (E) Flow cytometric analysis of ROS generation 2 d after transfection of constitutively active Map2k5 (n = 3 cultures; moi = 4). *P < 0.05 (linear regression). (F) Western blot analysis of MAPK7 in GS cells 2 d after supplementation with the indicated ROS inhibitors. (G) Western blot analysis of MAPK7 phosphorylation. The cells were incubated with hydrogen peroxide (30 μM) for indicated time points before sample collection. (H) Western blot analysis of GS cells 2 d after transfection with constitutively active Map2k5 or Mapk14 (moi = 10). (I) Western blot analysis of GS cells 1 d or 4 d after supplementation with a MAPK14 or MAPK7 inhibitor, respectively. (J) Western blot analysis of Mapk14f/f GS cells 3 d after AxCANCre treatment (moi = 2). (K) Macroscopic appearance of a recipient testis that underwent transplantation of GS cells cultured with XMD 8-92 for 6 d. Scale bar: 1 mm. (L) Colony counts (n = 12 testes). *P < 0.05 (t test). (M) Total number of SSCs recovered from culture (n = 12 cultures). *P < 0.05 (t test). Data information: In (A, B, D, E, L, M), data are presented as mean ± SEM. *P < 0.05 (t test).

