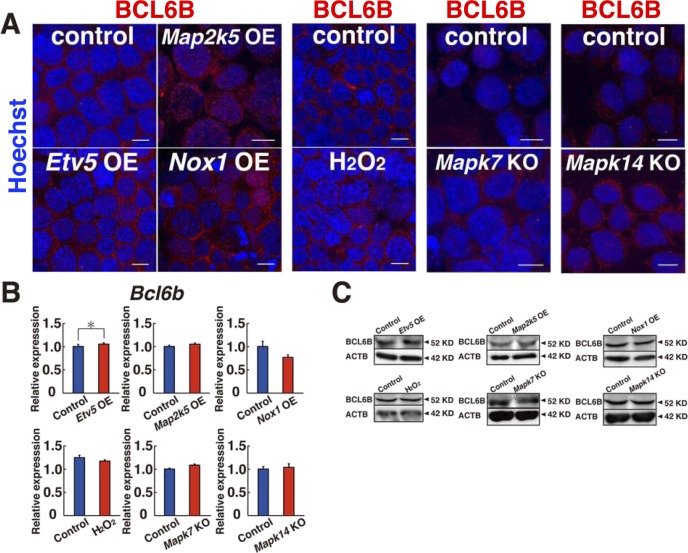
Figure S9. Expression of BCL6B in GS cells after indicated treatment.
The cells were analyzed 2 d after the treatment (moi = 4). For Mapk7 KO and Mapk14 KO cells, immunostaining was performed 1 d after AxCANCre treatment (moi = 2). (A) Immunostaining. (B, C) Real-time PCR (B) and Western blot (C) (n = 3 cultures). Scale bar: 10 μm. *P < 0.05 (t test). Data information: in (B), data are presented as mean ± SEM.

