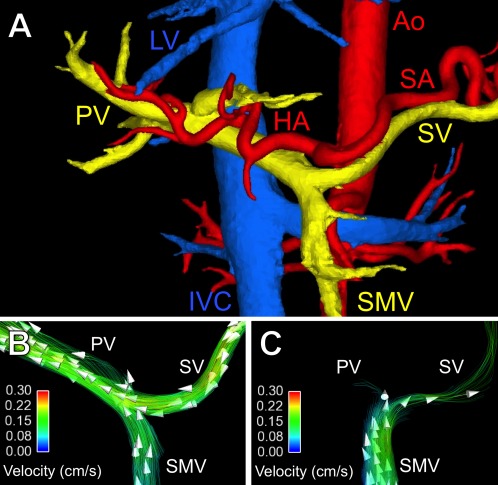
Figure 4.

Anatomical visualization and quantification of hepatic blood flow using 4D‐flow MR imaging. (A) Segmentation of phase contrast angiograms in a healthy adult. Arterial vessels are indicated in red, venous vessels in blue, and the portal vasculature in yellow. Hemodynamics of the portal blood flow in (B) the same healthy adult and (C) a patient with portal hypertension due to liver cirrhosis. Streamline colors illustrate the flow velocity and arrowheads the flow direction. Note the hepatopetal flow in the splenic vein (SV), superior mesenteric vein (SMV), and portal vein (PV) in the healthy adult. In the patient with liver cirrhosis and portal hypertension, there is only minimal flow in the PV and hepatofugal flow in the splenic vein. Ao = aorta, HA = hepatic artery, SA = splenic artery, IVC = inferior vena cava, LV = liver veins.
