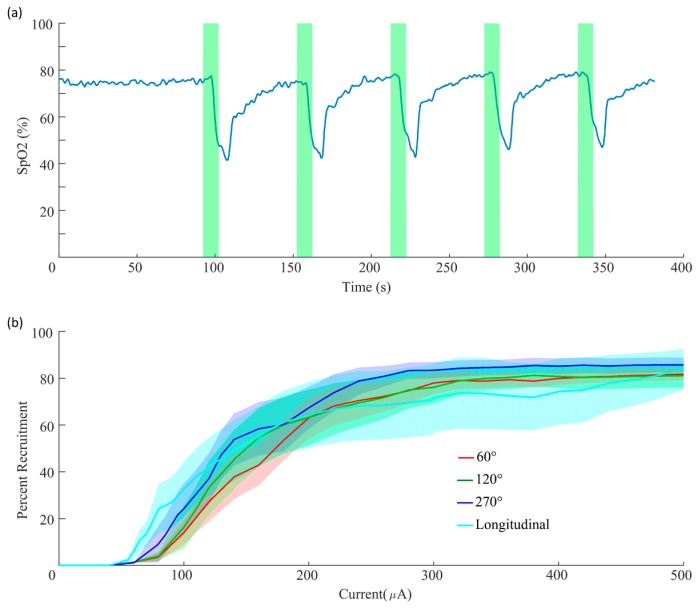
Figure 15.
Oxygen Saturation Reductions and Sciatic Nerve Dose-Response Curves; (a) Representative Oxygen Saturation Data During Repeated VNS; Blue line indicates oxygen saturation levels in the animal’s blood over time. Green vertical bars represent vagus nerve stimulation at multiple time points. (b) Average Sciatic Fiber Recruitment Functions for All Cuff Styles; shaded area represents error of the mean.

