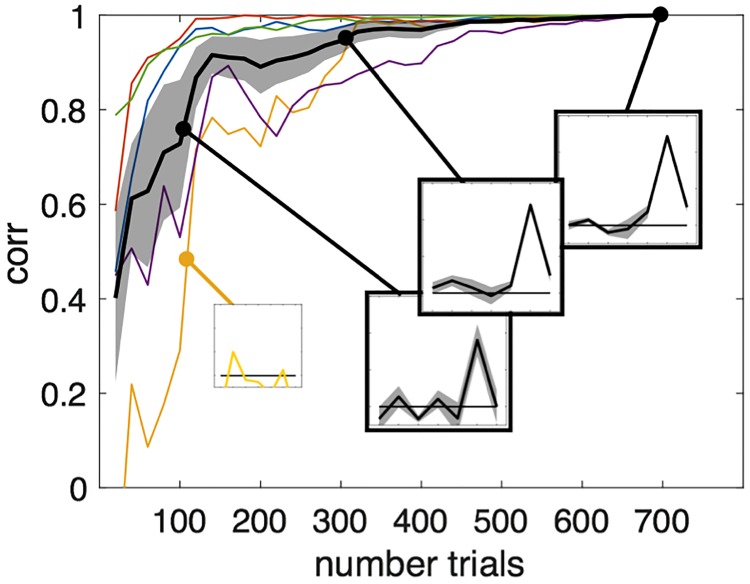
Fig 6.
Correlation between the kernel derived using the n first trials of case-study 1, and the kernel derived using all trials (n = 700); n varying by steps of 20 trials (individual curves: Thin colored lines; averaged ± sem: Thick black line with shaded error bars). These curves reflect the “speed” at which our measure converges toward the final kernel estimate (insets show temporary kernels at stages n = 100, n = 300 and n = 700, averaged across subjects in black line, and for the subject with the slowest convergence in yellow).

