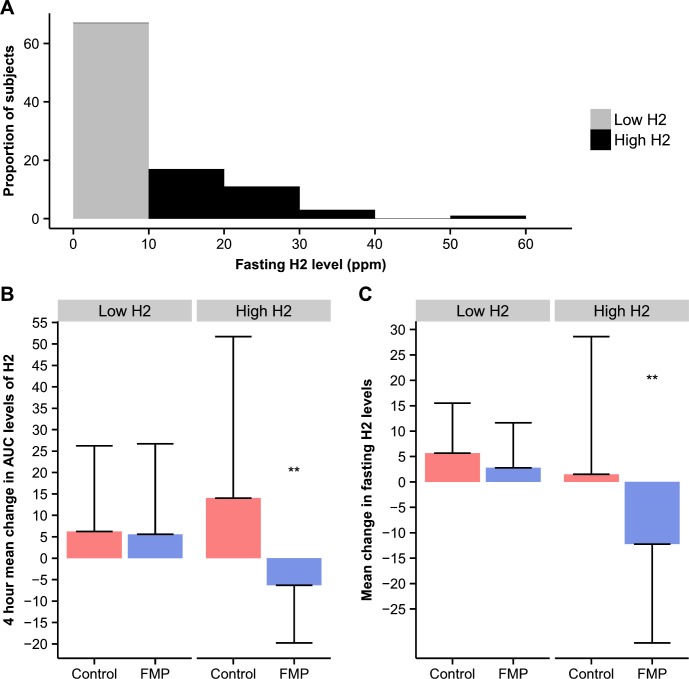
Fig 2. Effect of intervention on breath hydrogen in IBS patients stratified according to fasting H2 levels.
A) Distribution of subjects in % according to H2 fasting value B) Effect of the intervention on the 4h mean change in AUC levels of H2 C) Effect of the intervention on the mean change in fasting H2 levels (T0); FMP: fermented milk product; Control: non-fermented milk product; High H2: fasting H2 level≥10ppm (n = 33); Low H2: fasting H2 level<10ppm (n = 67); ppm: parts per million; H2: hydrogen; T0: fasting value; statistical analyses for B) and C) are covariance analyses of the mean change (Δ) of the measured endpoints from 1st to 2nd nutrient-lactulose challenge between the two study arms adjusted for first challenge values; all significance tests were two-sided and conducted at the 5% significance level. Interaction was evaluated at 10% significance level; NS for p value >0.05, * <0.05, ** <0.01, *** <0.001.

