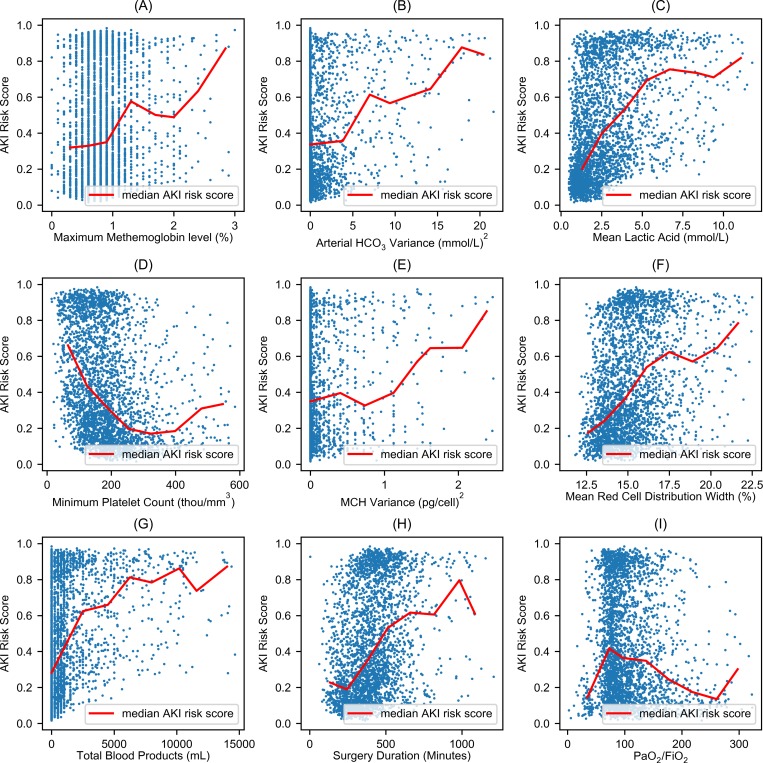
Fig 5. Nonlinear association between risk of postoperative acute kidney injury and intraoperative features.
Each blue dot represents a patient that developed postoperative AKI. The y-axis represents the risk probability for postoperative acute kidney injury, which ranges from 0 to 1. The red line represents the median acute kidney injury risk score given the values of x. The x-axes represent (A) maximum intraoperative percentage of methemoglobin in arterial blood gasses, (B) intraoperative variance of bicarbonate (mmol/L)2 in arterial blood gasses, (C) intraoperative mean of lactic acid (mmol/L), (D) minimum intraoperative platelet count (thou/mm3), (E) intraoperative variance of mean corpuscular hemoglobin, MCH (pg/cell)2, (F) intraoperative mean of red cell distribution (%), (G) total of blood products administered during surgery (mL), and (H) duration of surgery (minutes).

