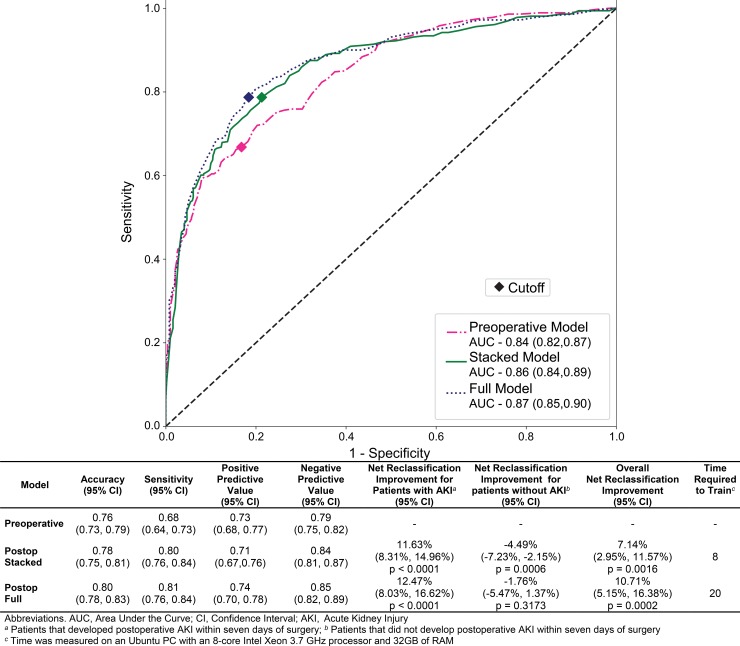
Fig 6. Receiver operating characteristic curves and other performance metrics for prediction of postoperative acute kidney injury.
The graph at the top of the figure is the receiver operating characteristic curves for prediction of postoperative acute kidney injury (AKI) within the first seven days after surgery for the preoperative model (pink), the postoperative stacked model (green), and the postoperative full model (blue). The diamonds on each curve represent the cutoffs calculated by maximizing the Youden Index. The y-axis is sensitivity, which ranges from zero to one. The x-axis is one minus specificity, which ranges from zero to one. The table in the bottom of the figure contains the following performance metrics for the preoperative and both postoperative models: (A) accuracy (percentage of patients correctly classified), (B) sensitivity (percentage of patients that developed AKI that were classified as high-risk), (C) positive predictive value (percentage of high-risk patients that developed AKI), (D) negative predictive value (percentage of low-risk patients that did not develop AKI), (E) net reclassification improvement for patients that developed postoperative AKI (F) net reclassification improvement for patients that did not develop postoperative AKI, (H) overall net reclassification improvement.

