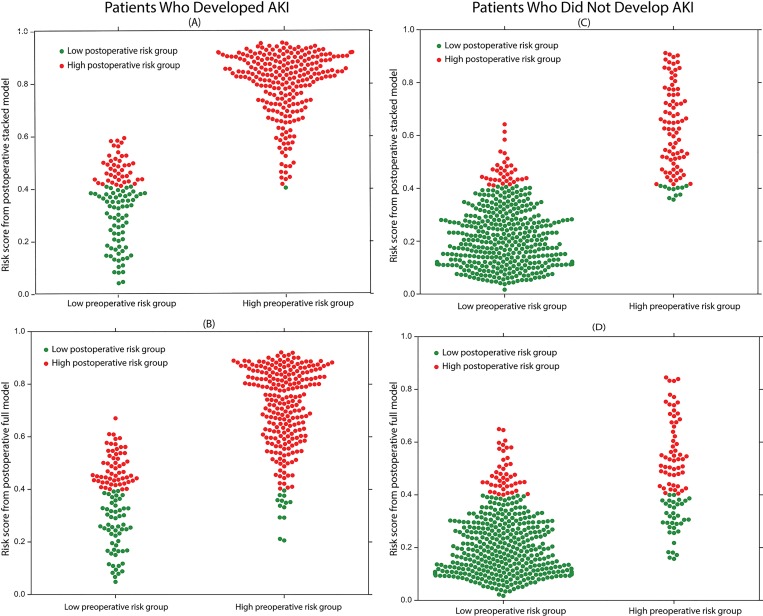
Fig 7. Reclassification performance of the postoperative stacked and full models for predicting postoperative acute kidney injury.
The postoperative risk scores in the first column are from the stacked model, while the postoperative risk scores for the second column are from the full model. The patients in the first row developed postoperative AKI within seven days of surgery, whereas the patients in the second row did not develop postoperative AKI within seven days of surgery. The y-axis on each plot is the postoperative model acute kidney injury risk score, which ranges from zero to one. The x-axis on each plot is the preoperative risk group. The red dots are patients at high-risk for AKI according to the postoperative model, whereas the green dots are patients at low-risk for AKI according to the postoperative model. (A & B) The proposed postoperative stacked and full models effectively reclassified false negative patients from the preoperative model as high AKI risk patients.

