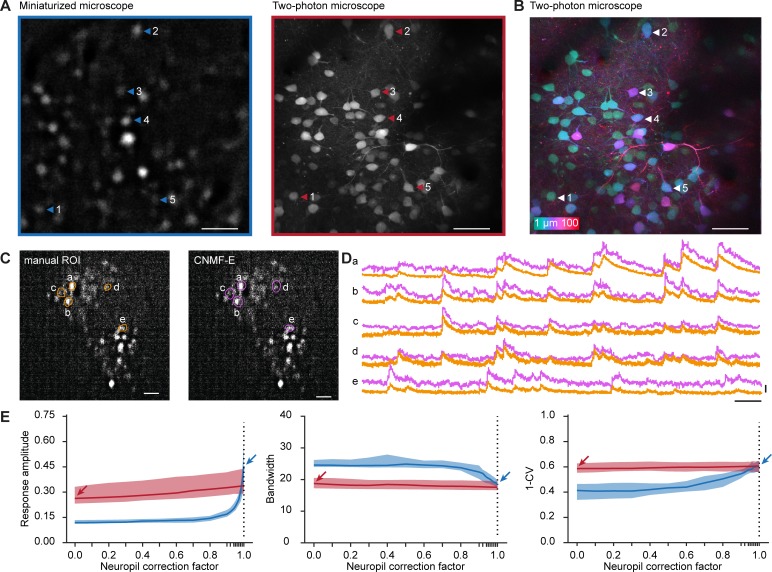
Fig 2. Imaging of visually evoked responses using a miniaturized microscope and a two-photon microscope.
A. A background-subtracted image acquired with a miniaturized microscope (left) and a collapsed volume (100 planes, 1 μm spacing) acquired with a two-photon microscope (right). Example neurons matched across microscopes are indicated with arrowheads. B. Pixel-wise color-coded depth origin of the collapsed two-photon volume. C. Contours of neurons detected with either manual ROI selection (green, left) or CNMF-E (pink, right) within the same background-subtracted field of view recorded with a miniaturized microscope. D. Relative fluorescence changes (ΔF/F) of example neurons indicated in C. E. Median response amplitude (ΔF/F), bandwidth and global orientation selectivity index (1-CV) as a function of neuropil correction factor in recordings acquired from orientation tuned neurons using a miniaturized microscope (blue) and a two-photon microscope (red). Arrows indicate parameter values at the selected neuropil correction factor of miniature microscopy (blue) and two-photon microscopy (red). Colored shading indicates 95% confidence interval. Scale bars, 50 μm (A, B), 100 μm (C), 25 s (D, horizontal), 1 ΔF/F (D, vertical).

