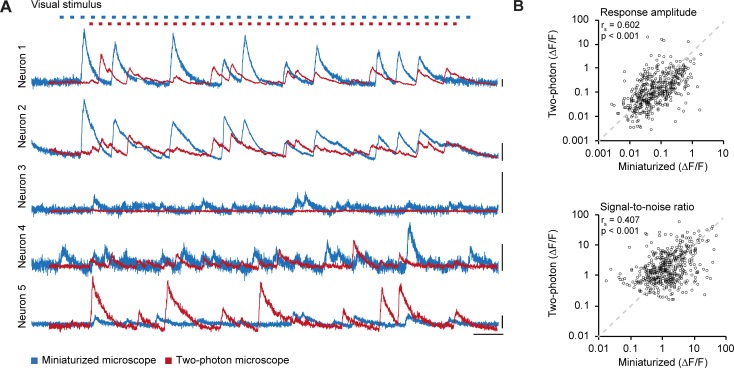
Fig 3. Calcium traces in miniaturized microscope and two-photon microscope recordings.
A. Relative fluorescence changes (ΔF/F) for the five example neurons depicted in Fig 2A and 2B as recorded with a miniaturized microscope (blue) and a two-photon microscope (red) during visual stimulation. Top: Blue and red marks indicate stimulus presentation for miniaturized microscopy and two-photon microscopy, respectively. Stimuli were presented in a pseudo-randomized order that was unique for each experiment. B. Average ΔF/F response amplitude to the preferred stimulus (p = 1.841·10–49, Spearman’s correlation) and ΔF/F signal-to-noise ratio of stimulus-induced calcium transients (p = 6.348·10–21, Spearman’s correlation) of all matched neurons (488 neurons, n = 8 mice) in miniaturized microscope recordings plotted against the respective values in two-photon microscope recordings. Scale bars, 1 ΔF/F (A, vertical), and 25 s (A, horizontal).

