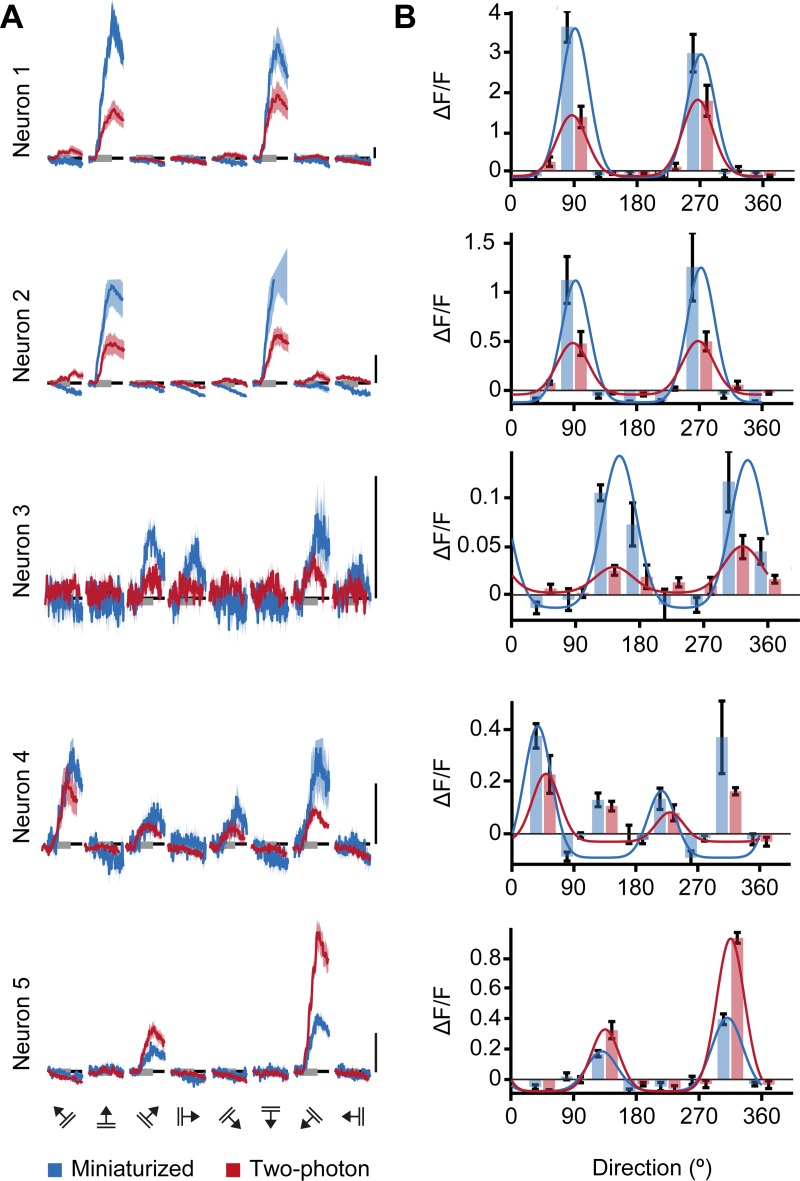
Fig 4. Orientation tuning curves of V1 neurons match between miniaturized microscopy and two-photon microscopy.
A. A Calcium responses as acquired with a miniaturized microscope (blue) and a two-photon microscope (red) in response to drifting gratings (8 directions, 5 repetitions) of the five example neurons depicted in Fig 2A and 2B. B. Bars show the mean (± SEM) responses of the same neurons imaged with a miniaturized microscope (blue) and a two-photon microscope (red). Overlaid blue and red lines indicate the fitted tuning curves. Scale bars, 1 ΔF/F.

