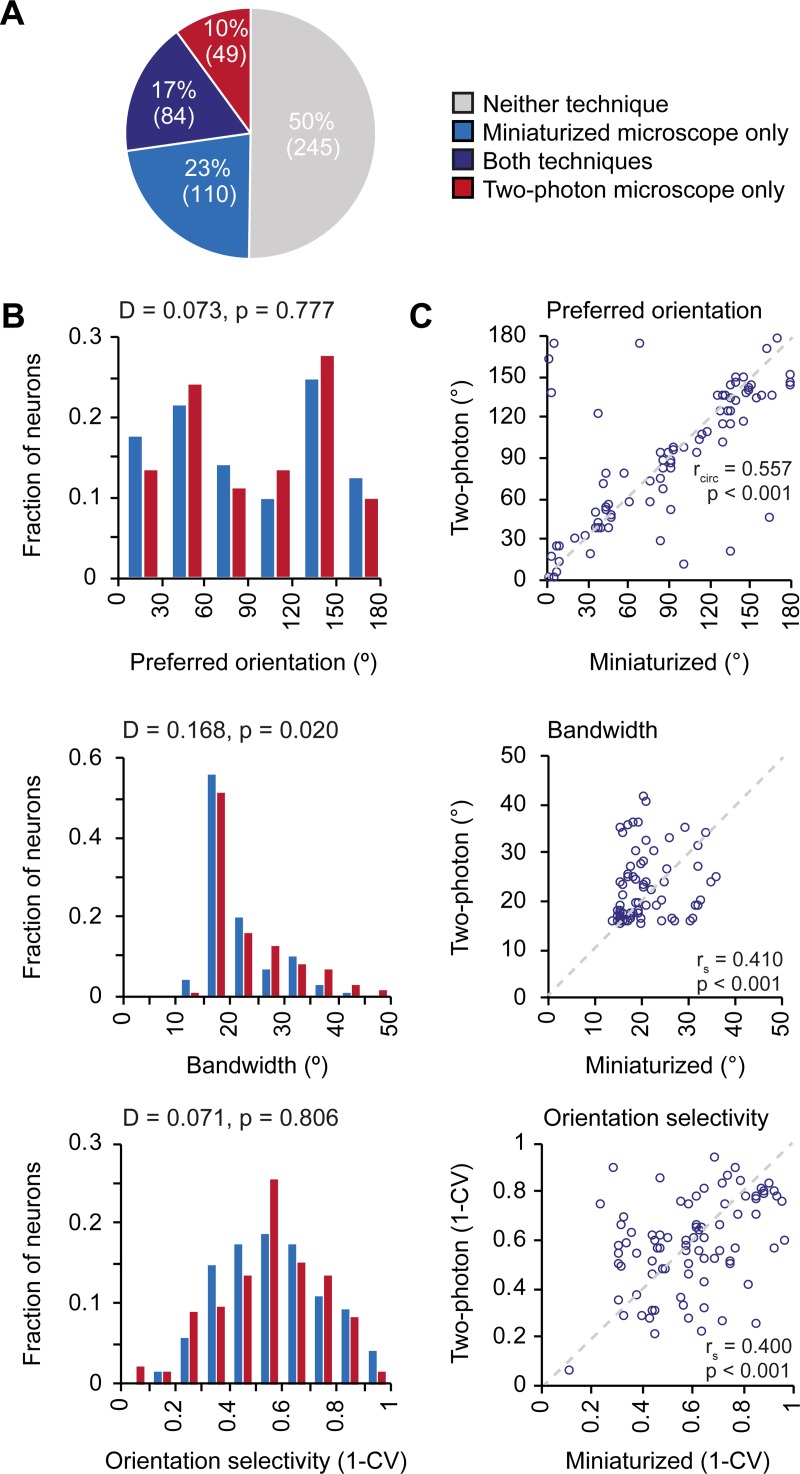
Fig 5. Orientation tuning properties of V1 neurons as imaged with a miniaturized microscope and a two-photon microscope.
A. A Fractions of neurons that were classified as orientation tuned in miniaturized microscope recordings only (blue), using both microscopy techniques (purple), in two-photon microscope recordings only (red), or using neither microscopy technique (gray). B. Distribution of preferred orientation (p = 0.777, two-sample Kolmogorov-Smirnov test), bandwidth (p = 0.020, two-sample Kolmogorov-Smirnov test), and global orientation selectivity index 1-CV (p = 0.806, two-sample Kolmogorov-Smirnov test) for all neurons that were orientation tuned in recordings with a miniaturized microscope (blue bars, 194 neurons, n = 7 mice) or a two-photon microscope (red bars, 133 neurons, n = 6 mice). C. Preferred orientation (p = 2.02·10–6, circular correlation), bandwidth (p = 1.23·10–4, Spearman’s correlation), and global orientation selectivity index 1-CV (p = 1.81·10–4, Spearman’s correlation) for individual neurons (purple circles) that were orientation tuned using both microscopy techniques (84 neurons, n = 5 mice). The unity line is depicted as gray dashed line.

