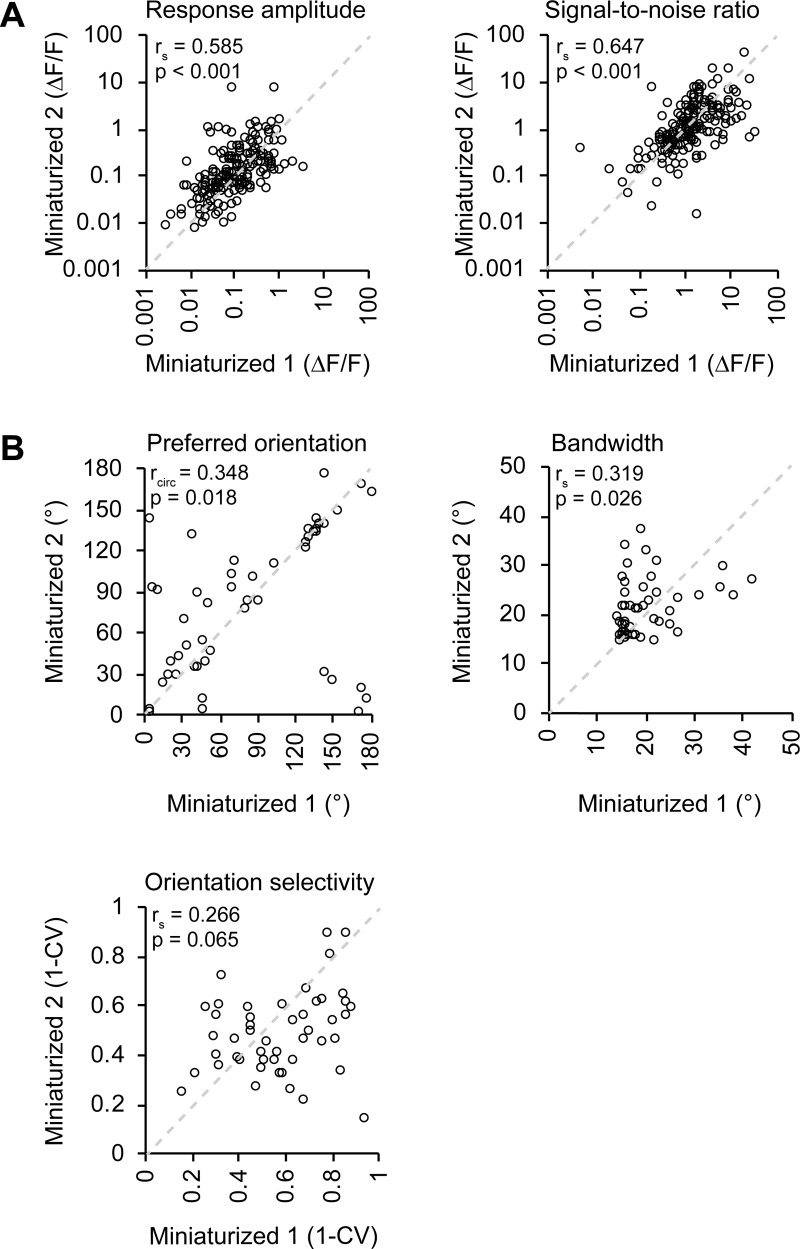
Fig 6. Effect of test-retest variability on recorded response properties in V1.
A. A Average ΔF/F response amplitude to the preferred stimulus (p = 4.780·10–18, Spearman’s correlation) and ΔF/F signal-to-noise ratio of stimulation-induced calcium transients (p = 6.451·10–23, Spearman’s correlation) of matched neurons (181 neurons, n = 4 mice) in two consecutive miniaturized microscopy sessions (Miniaturized 1 and Miniaturized 2). B. Preferred orientation (p = 0.018, circular correlation), bandwidth (p = 0.026, Spearman’s correlation), and global orientation selectivity index 1-CV (p = 0.065, Spearman’s correlation) for individual neurons (black circles) that were orientation tuned during both consecutive microscopy sessions and visually detected in the two-photon microscopy session (49 neurons, n = 3 mice).

