
Fig. 2.
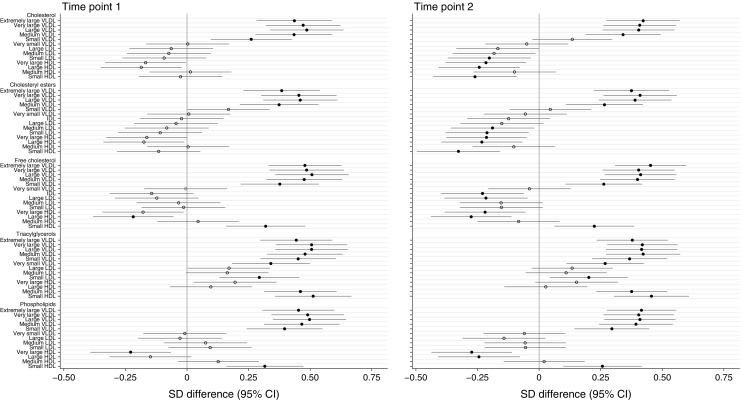
Differences in lipoprotein subclass constituents between GDM and non-GDM women at time points 1 and 2. Lipoprotein subclass constituent contents were measured at time points 1 and 2. Data points show the SD difference between GDM and non-GDM women prior to diagnosis of GDM (time point 1) and at the time of OGTT (time point 2). Positive associations with GDM are shown to the right, negative associations are shown to the left. Closed black circles represent FDR-corrected p values of <0.05. Free cholesterol, non-esterified cholesterol