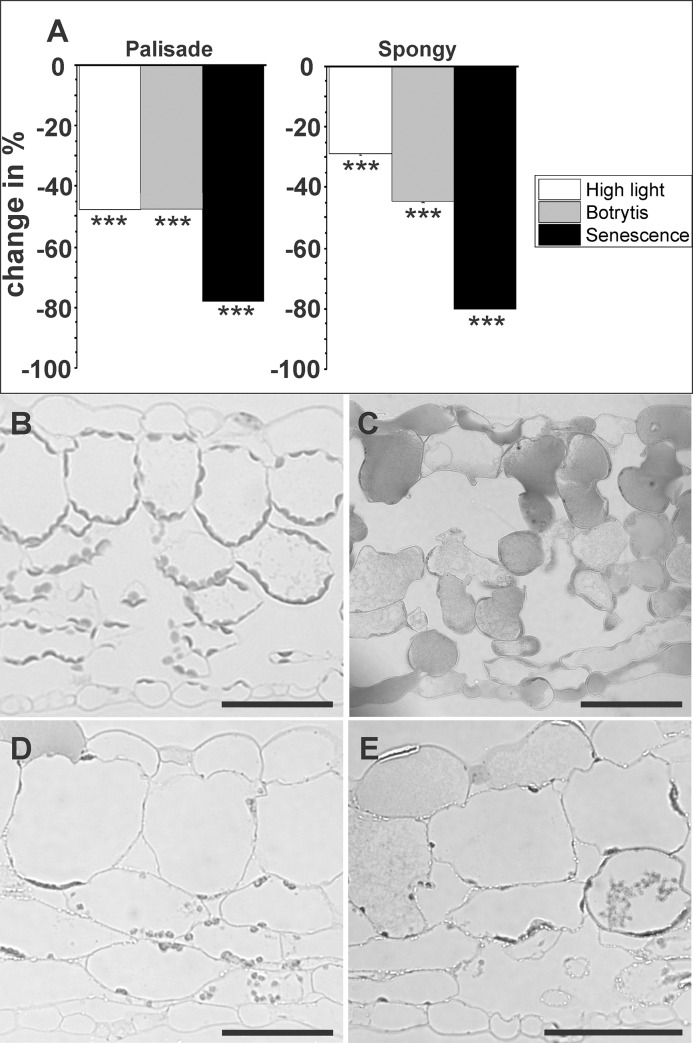
Fig 2. Changes (%) in the number of plastids in the palisade cell layer and the spongy parenchyma induced by high light, Botrytis infection, and senescence.
Data in graphs (A) are means with standard errors determined by image analysis on semi-thin cross sections of leaves according to Table 1. Plastids per sectioned cell (n>100 per treatment) were counted with a light microscope in four replicate semi-thin sections of control plants (B), plants grown under high light conditions of 1,500 μmol m-2 s-1 (C), inoculated with Botrytis (D), and after dark induced senescence (E). Significant differences were calculated using the Mann- Whitney U test; *** indicate a significance at a level of confidence of p<0.001. Bars = 100 μm.

