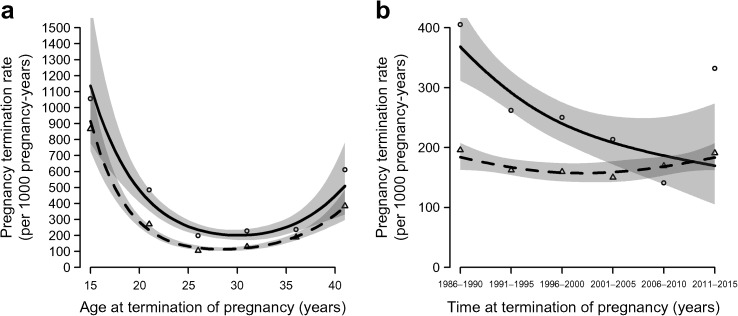
Fig. 1.
Pregnancy termination rates per 1000 pregnancy-years: (a) by age (p = 0.38); and (b) by calendar time (p = 0.11). The p values are for the difference between women with and without diabetes; 95% CIs are shown as shading. Solid line with circles, with type 1 diabetes; dashed line with triangles, without type 1 diabetes

