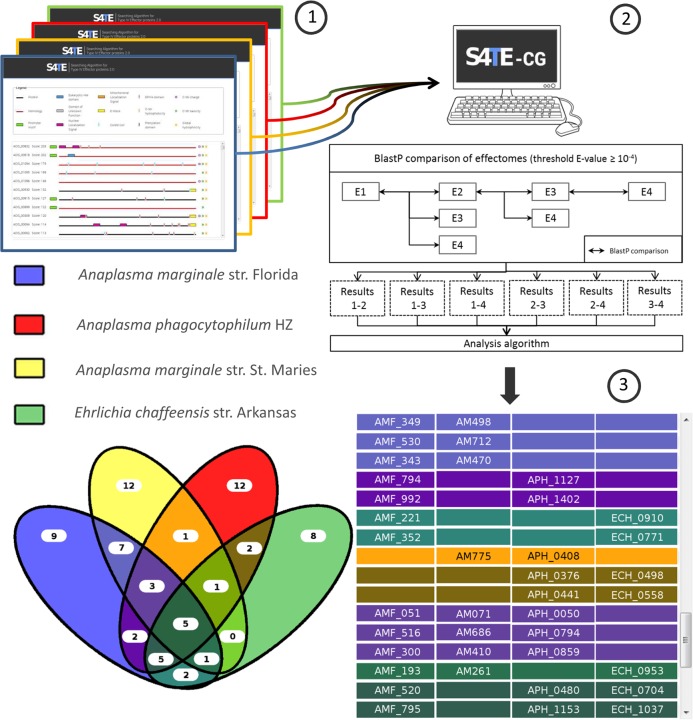
Fig 3. Flow chart of the comparison of 4 effectomes using S4TE-CG.
Users can compare up to four genomes simultaneously. (1) S4TE 2.0 results from selected genomes (effectomes) are compared with Blastp 2.2 to find homologous proteins in each effectome. (2) S4TE-CG successively compares all effectomes in a pairwise manner and calculates any overlaps between the effectomes of each genome. (3) The final results are plotted on a Venn diagram and listed in an interactive table.

