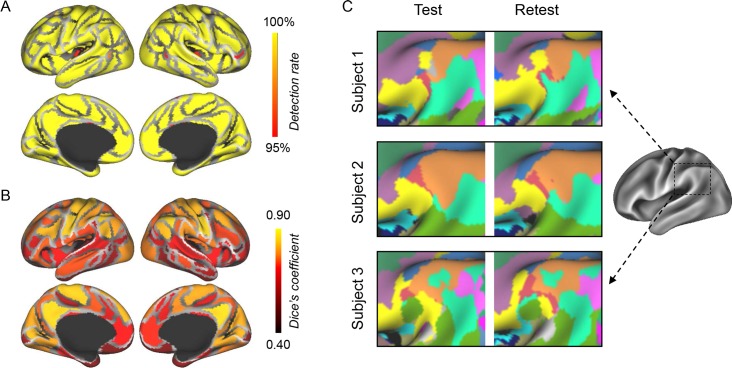
Fig 1. Homologous functional ROIs can be identified across subjects.
(A) Most of the 116 functional ROIs originally defined in the group-level atlas can be identified in individual subjects. The map demonstrates the percentage of the 677 subjects in whom a functional ROI could be detected. A few ROIs that were not identified in all subjects tended to be smaller in size (shown in red and orange). (B) Within-subject test-retest reliability values of the 116 functional ROIs. The test-retest reliability of each ROI was measured as the Dice’s coefficient of the results derived from the two scan sessions of each subject and then averaged across the 677 subjects. For each subject, if a region was undetected in one session, then the Dice’s coefficient of this region was set to zero. The mean Dice’s coefficient across the 116 ROIs was 69.8% ± 12.9% (mean ± SD). (C) ROIs in the TPJ extracted from three randomly selected subjects are illustrated as examples. The TPJ region is shown because it consists of multiple small patches belonging to different functional networks. The ROIs were reliably identified across different scan sessions. Different ROIs are represented by different colors. ROI, region of interest; TPJ, temporal-parietal junction.

