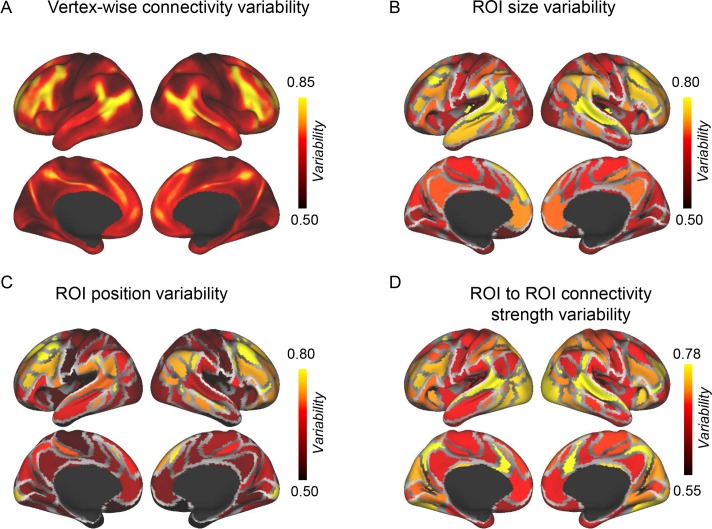
Fig 2. Intersubject variability in vertex-wise functional connectivity maps is associated with intersubject variability in the position of the functional regions.
(A) Intersubject variability in resting state functional connectivity was quantified at each vertex using the approach as described in Mueller and colleagues [5]. The association cortices showed stronger intersubject variability than the visual and motor-sensory cortices. (B) Intersubject variability in ROI size was quantified for each of the 116 ROIs, and the variability map showed a moderate correlation (r = 0.26) with the variability in vertex-wise connectivity. (C) Intersubject variability in ROI position was quantified for each ROI and showed a strong correlation (r = 0.49) with the variability in vertex-wise connectivity. (D) Intersubject variability in connectivity among individually specified ROIs was quantified and showed a strong correlation (r = 0.55) with the variability in vertex-wise connectivity (also see S2 Fig for the scatterplots). The visual and auditory cortices demonstrated unexpectedly strong intersubject variability in connectivity with other ROIs. All intersubject variability maps were corrected by underlying intrasubject variability (see Materials and methods). ROI, region of interest.

