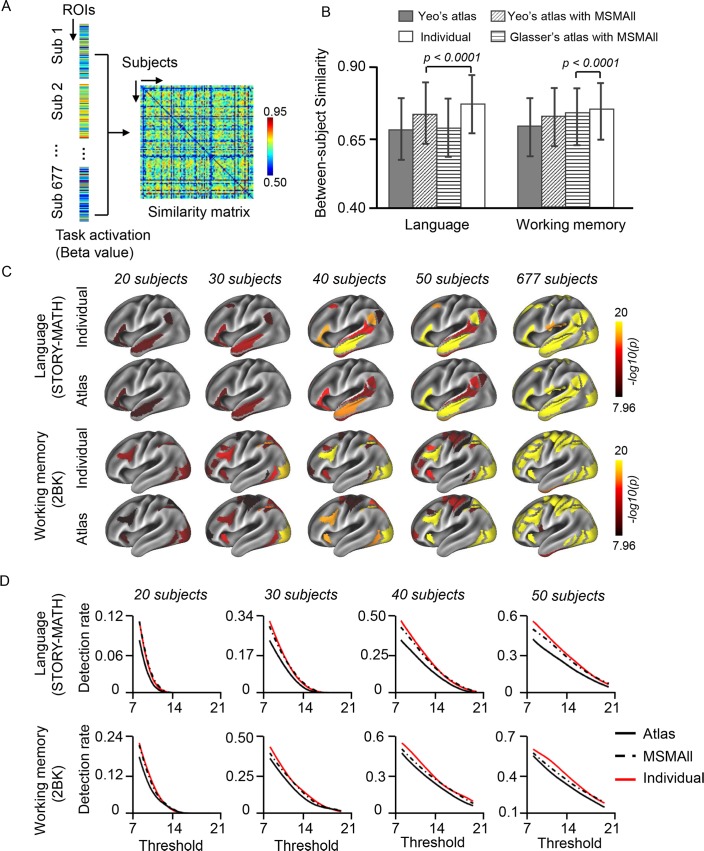
Fig 4. Aligning functional regions across individual subjects improves group-level task-fMRI analyses.
(A) Similarity of task activations between pairs of subjects. For each subject, task activation values (beta values) were averaged within each ROI; thus, the whole-brain activation pattern was represented by activations in ROIs. Similarity between two subjects was estimated by correlating their activation pattern in these ROIs. (B) The bar plots demonstrate the mean between-subject similarity values during the language and working memory tasks estimated by different approaches. Task activation patterns were more similar between two subjects if the ROIs were individually specified compared with atlas based (whether or not the data were aligned by MSMAll) (*p < 0.001, block bootstrap test, 1,000 permutations). Error bars indicate 2 standard deviations. See S3 Fig for the results of other tasks. (C) Group-level statistical analyses were performed in the individually specified ROIs and atlas-based ROIs using the mean activation (beta values) within each ROI (one-sample t test, p < 0.000001 for language and working memory tasks, Bonferroni correction for 92 comparisons). Results of the language and working memory tasks in subsets of the cohort (n = 20, 30, 40, 50) and in the full cohort were plotted (see S3 Fig for the results of other tasks). (D) Task-relevant regions could be better detected using the individually specified ROIs than using the atlas-based ROIs, independent of the selection of a significance threshold. Group-level task-activated regions were mapped using a series of significance thresholds. The results were then compared with the task-activated regions identified in the full cohort to determine the detection rate. The detection rate was higher for individually specified ROIs (red curves) than atlas-based ROIs (black curves). The MSMAll (dashed curves) improved the task activation but not as much as the individual ROIs. See S1 Data for numerical values. fMRI, functional MRI; MSM, multimodal surface matching; ROI, region of interest; Sub, subject.

