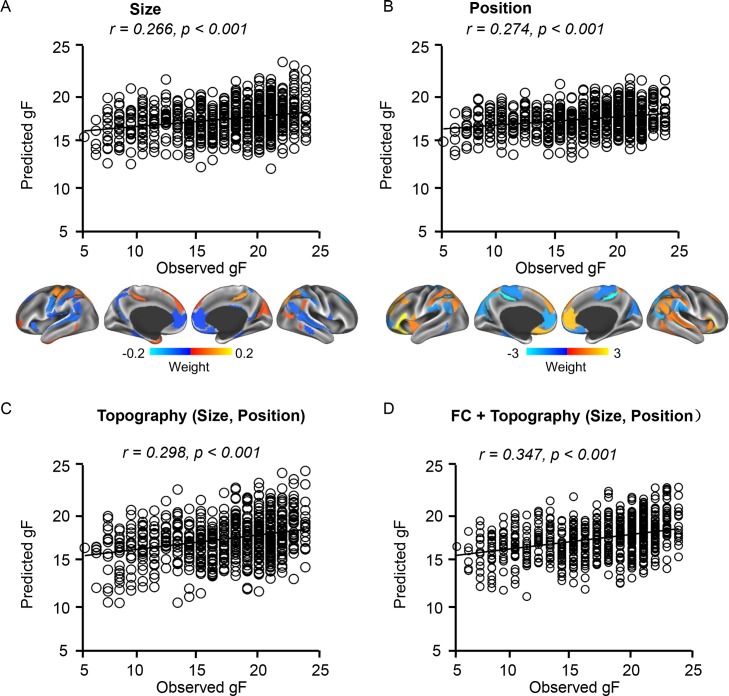
Fig 6. Topography of individually specified ROIs can predict gF.
(A) Size of brain regions can predict gF. Regions with prediction weight values above the global mean were mapped on the surface. Warm colors indicated regions whose size showed positive correlations with gF scores. Cold colors indicated regions whose size showed negative correlations with gF scores. (B) Position of brain regions can predict gF. Brain regions whose coordinates on the anterior-posterior axis could predict gF were plotted on the brain surface. Warm color indicates that more anterior position is related to higher gF. Cold color indicates that more posterior position is related to higher gF. (C, D) Combining topography and functional connectivity features can improve the prediction of gF. See S1 Data for numerical values. gF, fluid intelligence; ROI, region of interest.

