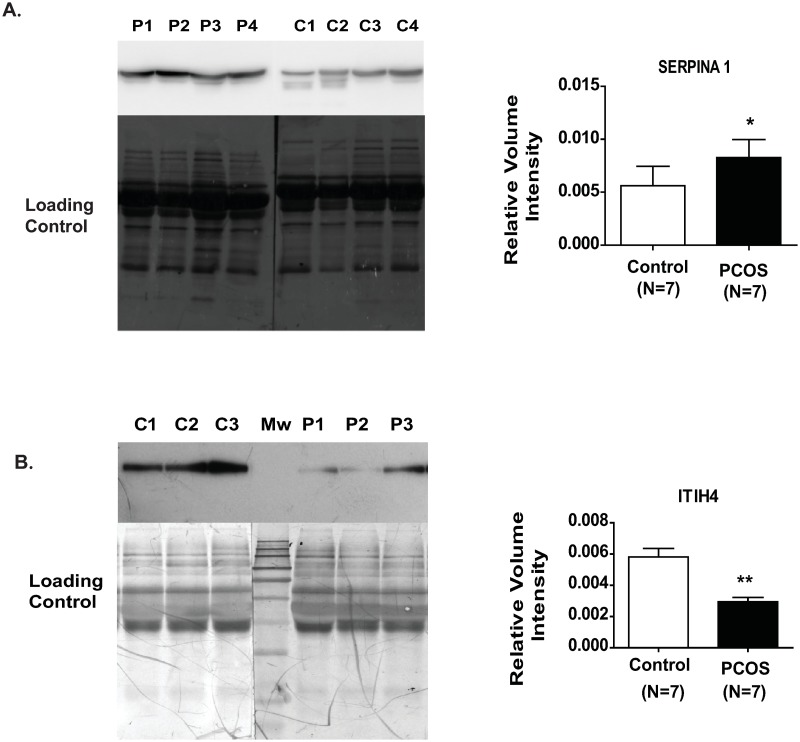
Fig 4. Validation of SERPINA1 upregulation (A) and ITIH4 downregulation (B), at protein level in follicular fluid by immunoblotting.
Each lane was loaded with 10 μg follicular fluid protein obtained from women with PCOS and controls. Lanes designated as C are control samples and as P are PCOS follicular fluid. The total protein load was used as loading control. Data are represented as mean ± S.D. Statistical comparison was done using Mann Whitney U tests. P values <0.05 are considered statistically significant.

